XRP Avoids Drop Below $2 as Bulls Regain Control
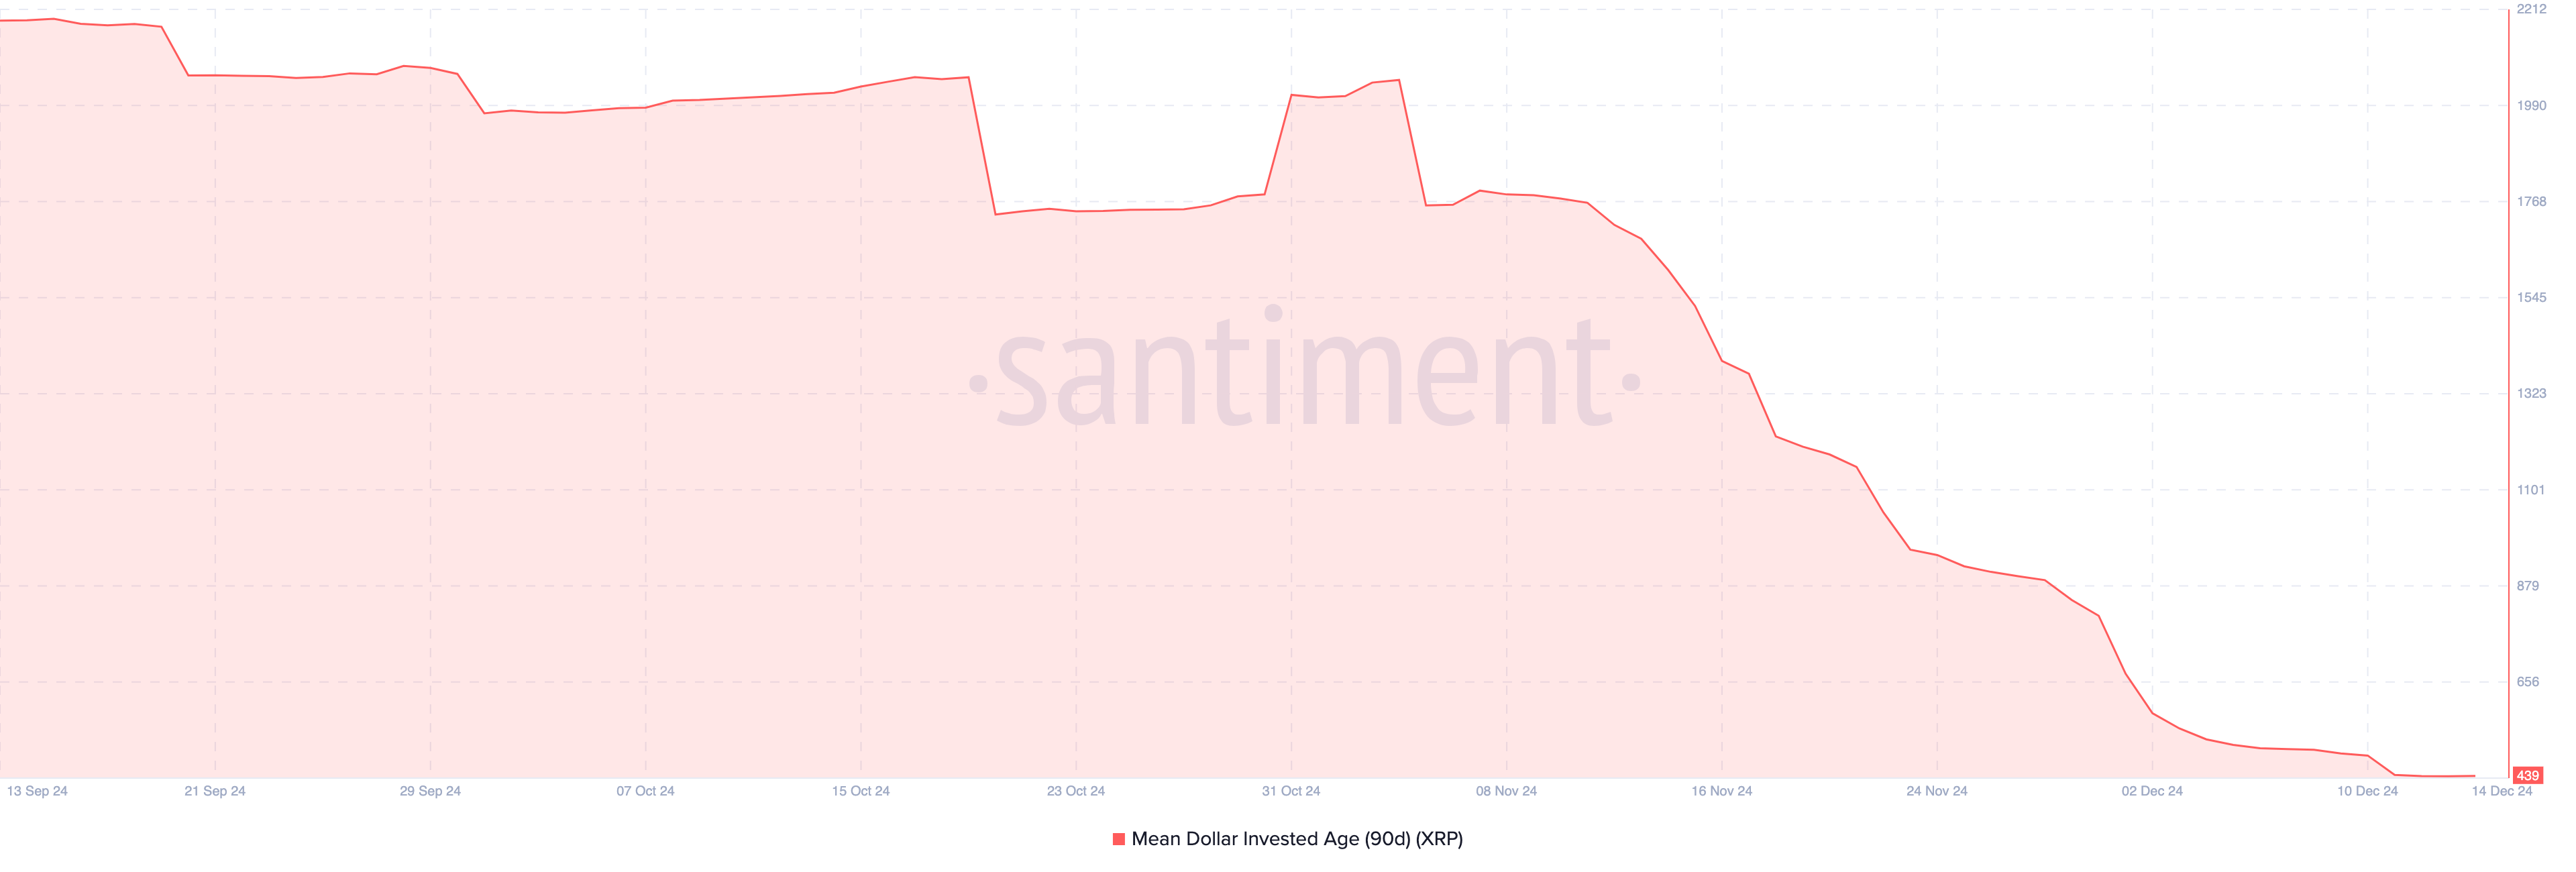
- XRP’s low Mean Dollar Invested Age indicates recirculating tokens, boosting liquidity and indicating bullish potential.
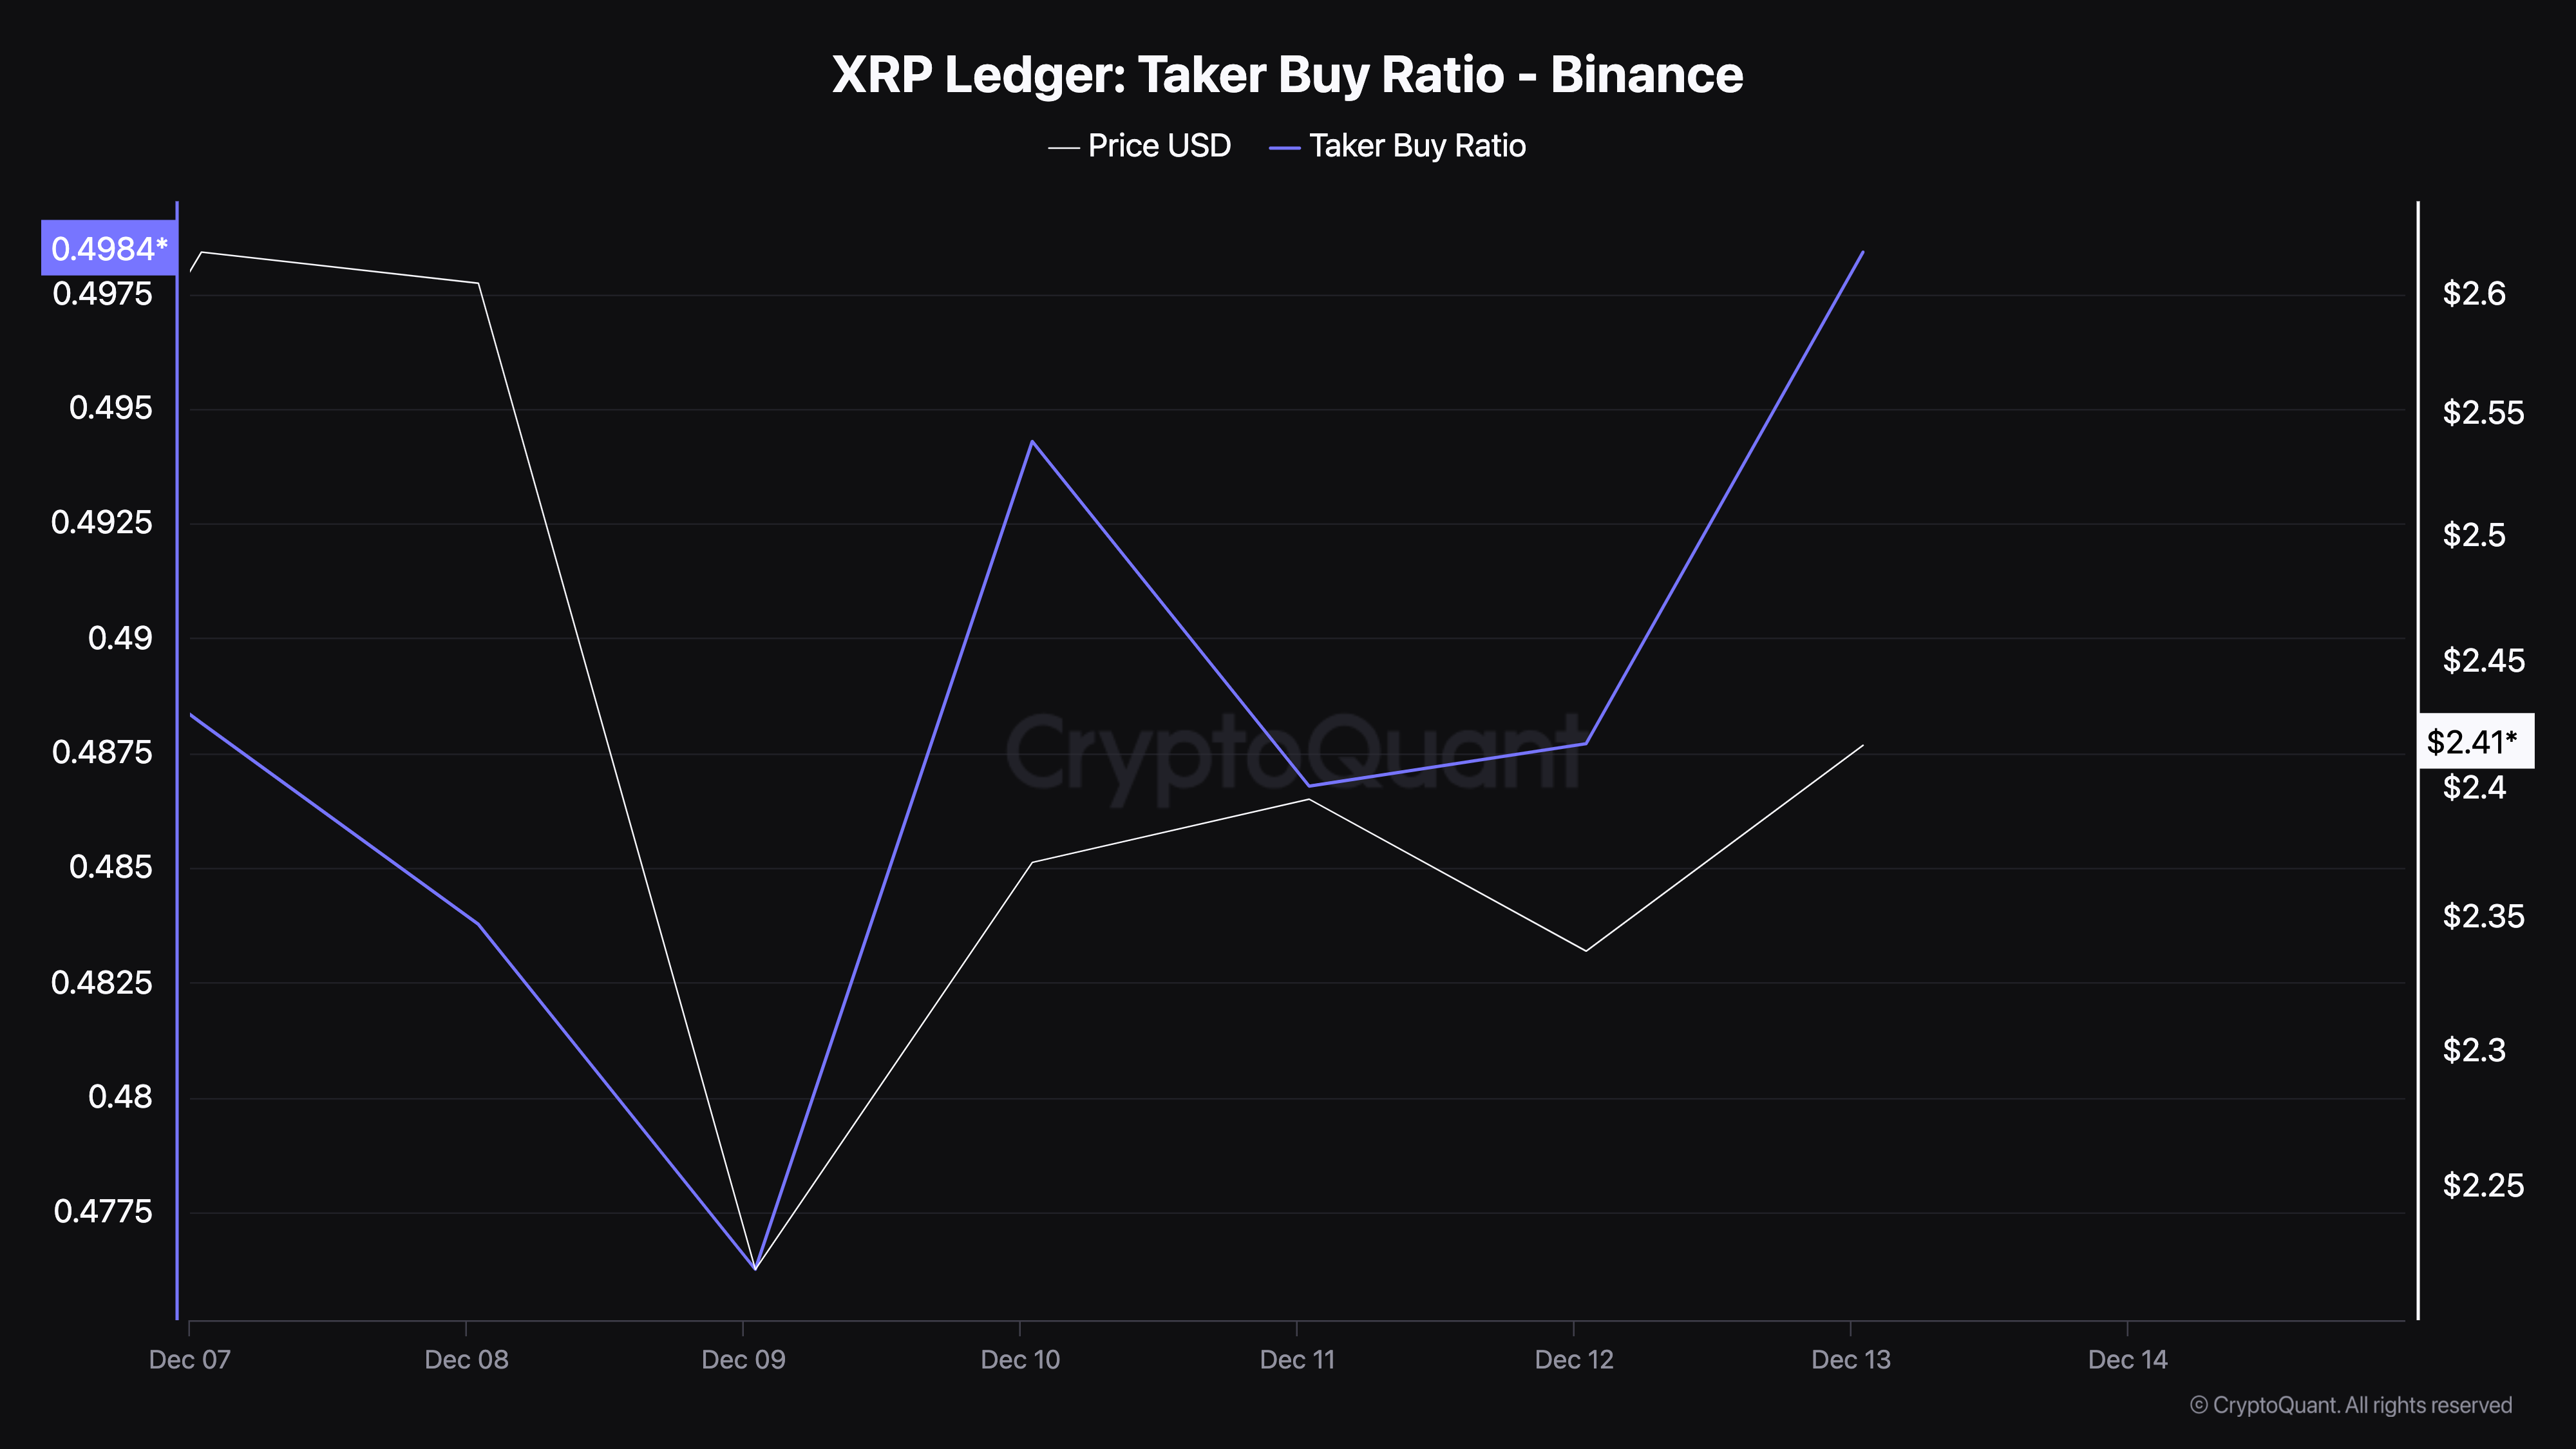
- At 0.55, the metric reflects increasing buy-side dominance in derivatives markets, fueling positive sentiment for XRP.
- XRP's price could rally to $2.90 and possibly $3.50. Reduced trading activity, however, risks a retreat to $1.93.
On December 10, Ripple’s (XRP) price temporarily slipped below $2, sparking speculation that its prolonged uptrend might be ending. However, the bearish concerns have been short-lived. XRP has rebounded strongly, recording an 8% upswing in the past 24 hours.
Interestingly, several under-the-radar indicators suggest that XRP’s rally for the year may still have room to grow. Here’s how.
Ripple Stakeholders Send More Tokens into Circulation
The Mean Dollar Invested Age (MDIA) is an on-chain metric that suggests XRP’s price could continue to trade higher. MDIA represents the average age of all tokens on a blockchain, weighted by their purchase value.
A rising MDIA indicates that coins, typically held by key stakeholders, have remained stagnant. Historically, this inactivity has made it difficult for the altcoin’s price to gain momentum. Currently, however, XRP’s MDIA has dropped to a notably low level. This metric, which reflects the median age of transacted tokens, signals the recirculation of previously dormant assets.
Unlike a high MDIA, which implies stagnation, a low MDIA is considered a bullish signal. The decrease shows that dormant XRP tokens have returned to circulation, boosting trading activity and liquidity.
Apart from the MDIAs, the Taker Buy Ratio also suggests the potential for further XRP price gains. This ratio measures the proportion of buy orders filled compared to total trades in the derivatives market.
A Taker Buy Ratio above 0.5 reflects growing bullish sentiment, suggesting that buyers are gaining control. According to data from CryptoQuant, the metric has climbed to 0.55, highlighting a significant jump in buying pressure around XRP.
If this trend continues, it could signal strong market optimism, potentially pushing XRP to new price levels in the coming sessions. However, a dip below this threshold would indicate bearish sentiment, warranting caution.
XRP Price Prediction: Bulls Are in Control Again
On the 4-hour chart, XRP’s price had briefly dropped below the 20 and 50 Exponential Moving Averages (EMA) on December 12. The EMA is a technical indicator that measures trends.
When the price falls below these indicators, it typically signals a bearish trend, while a rise above them indicates bullish momentum. The recent downturn suggested a potential further correction for XRP.
As of now, however, bulls have regained control, pushing the price back above these lines. This shift indicates a return of bullish momentum, with XRP potentially climbing to $2.90 in the short term.
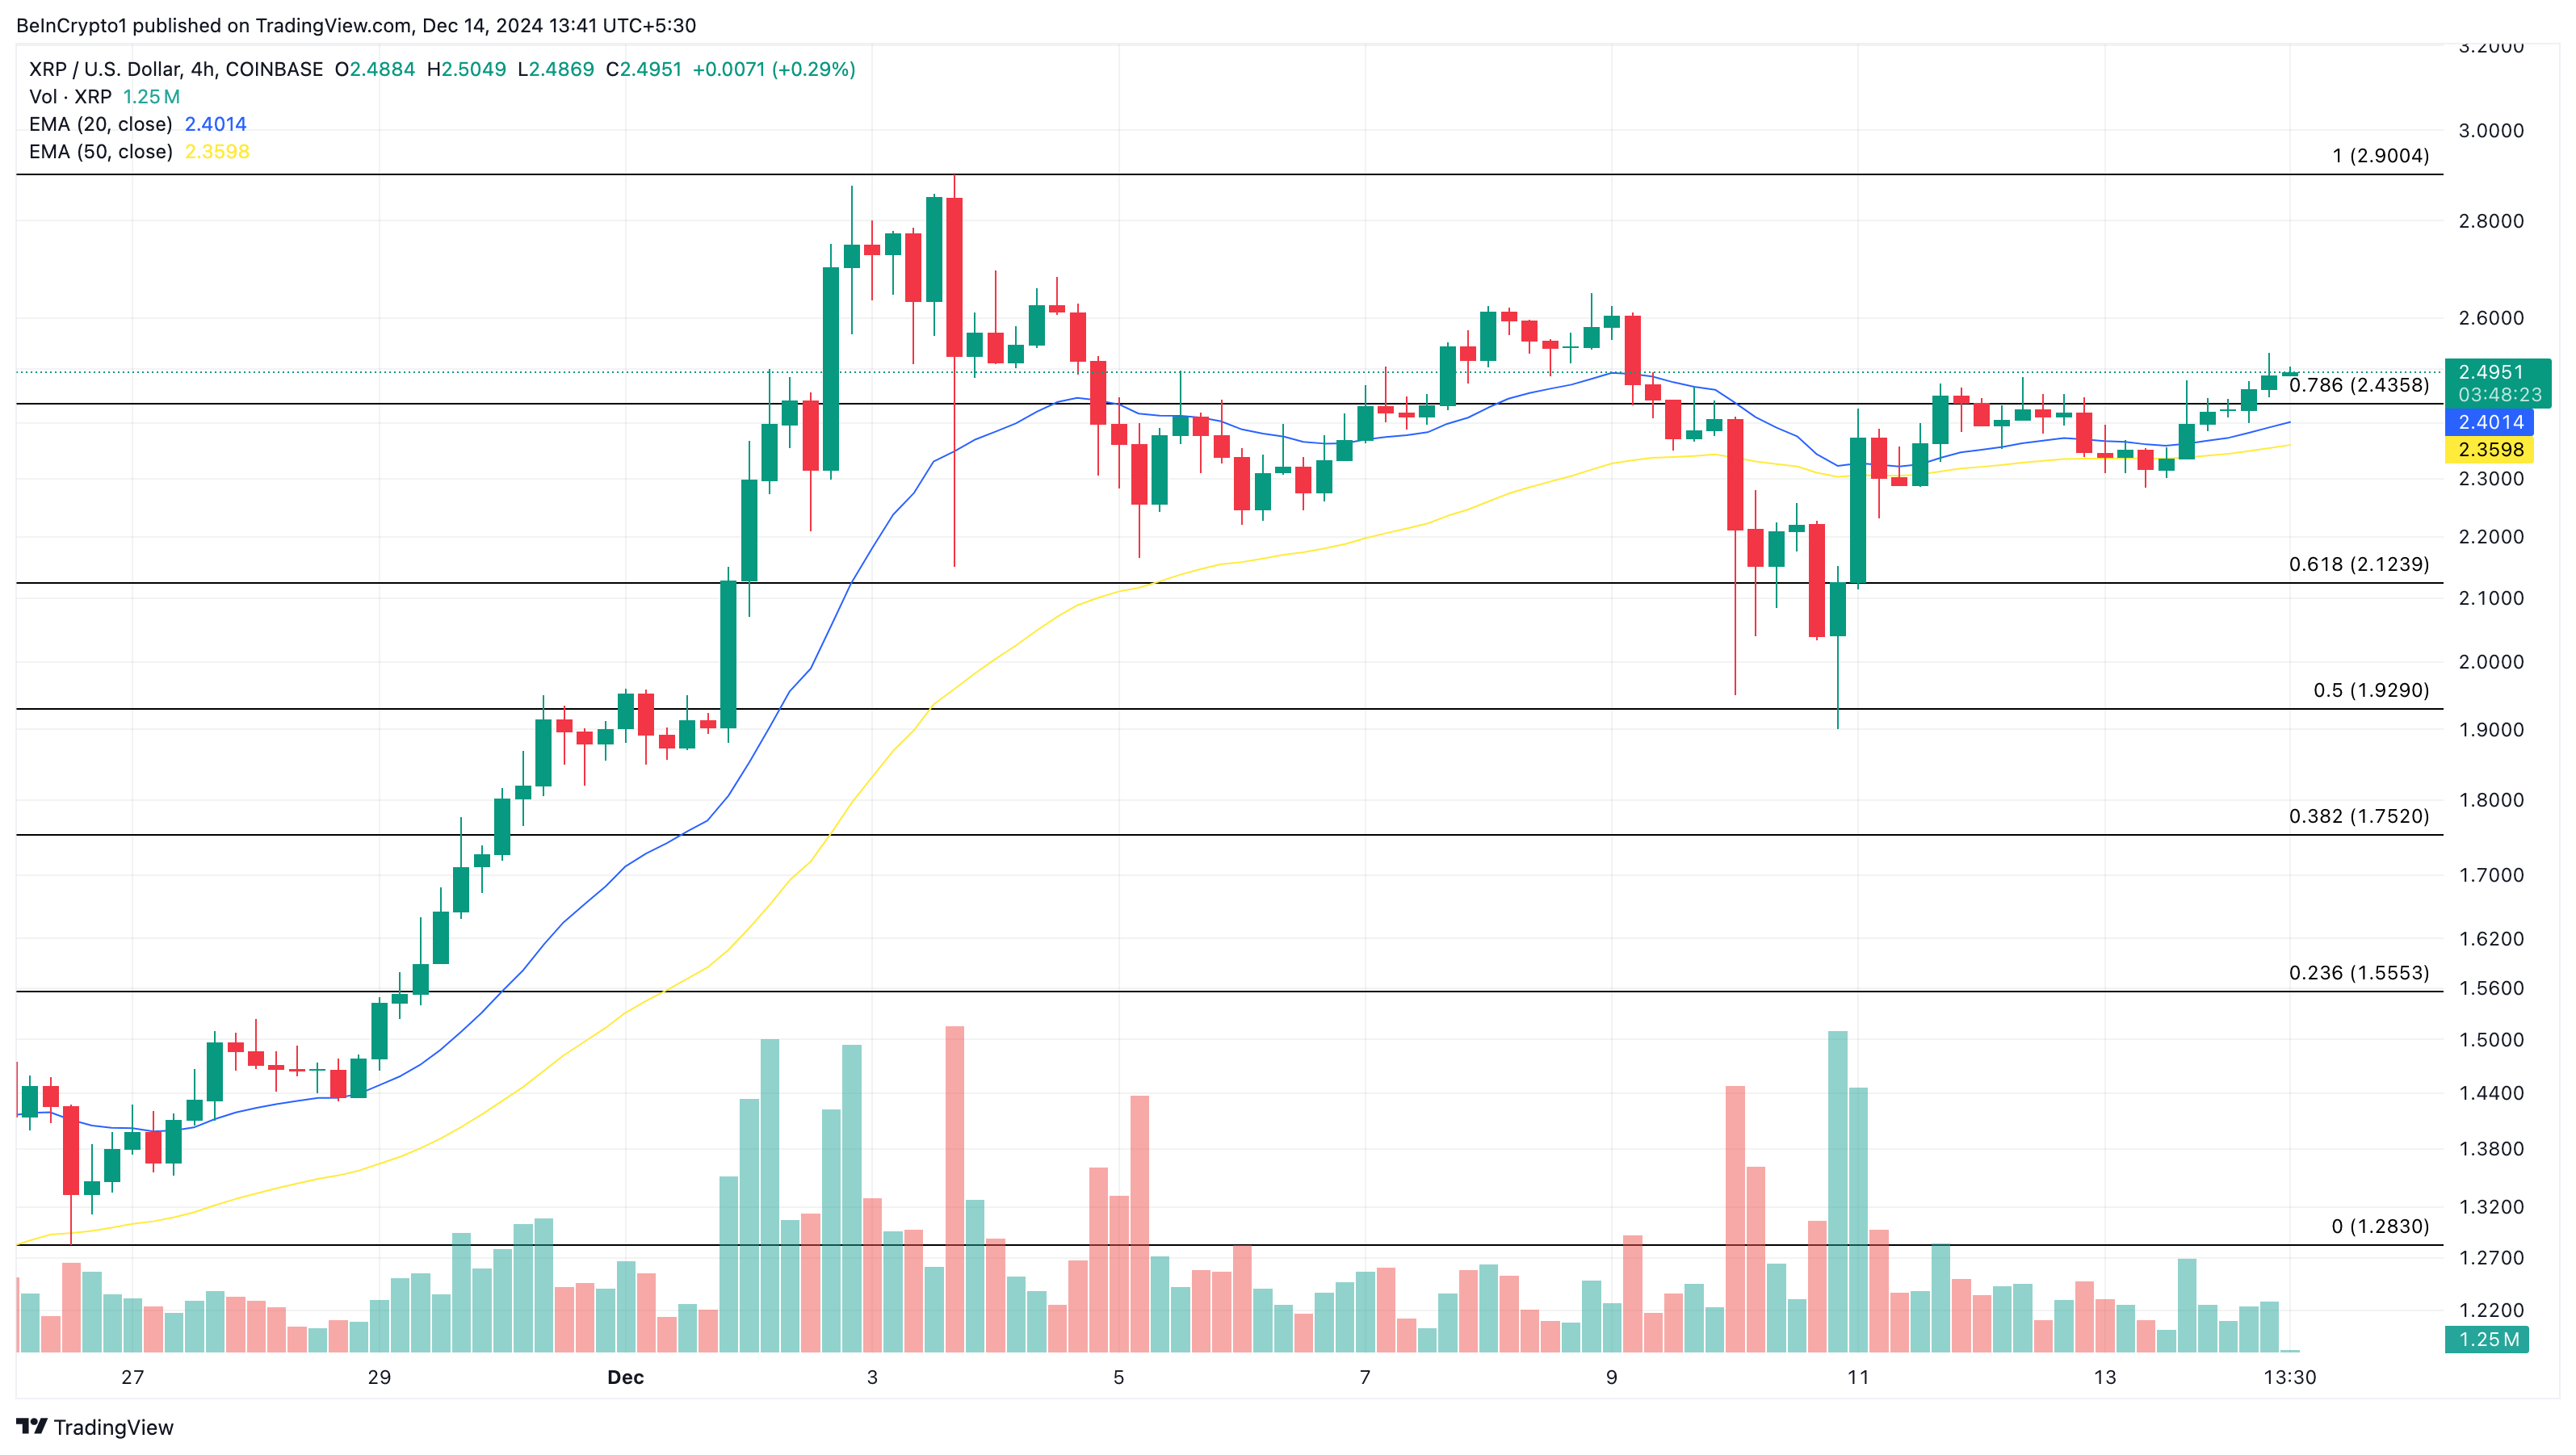
If buying pressure intensifies, it could rally toward $3.50. On the flip side, if the number of dormant tokens flowing into circulation drops, this might not happen, and the token could decline to $1.93.
免責聲明:投資有風險,本文並非投資建議,以上內容不應被視為任何金融產品的購買或出售要約、建議或邀請,作者或其他用戶的任何相關討論、評論或帖子也不應被視為此類內容。本文僅供一般參考,不考慮您的個人投資目標、財務狀況或需求。TTM對信息的準確性和完整性不承擔任何責任或保證,投資者應自行研究並在投資前尋求專業建議。
熱議股票
- 1
- 2
- 3
- 4
- 5
- 6
- 7
- 8
- 9
- 10