BitTorrent (BTT) Tops the Market, but the Trend May Not Hold
- BitTorrent (BTT) surged 4%, trading at $0.00000111, but key indicators suggest the rally lacks strong bullish momentum.
- The Aroon Up Line at 0% and a bearish MACD crossover highlight risks of a potential price correction.
- If selling pressure intensifies, BTT faces critical support at $0.00000093, with a chance to extend losses to $0.00000067.
BTT, the native token that powers the decentralized peer-to-peer (P2P) file-sharing platform BitTorrent, has emerged as the market’s top gainer in the past 24 hours, climbing by 4%.
However, while this uptick may reflect a renewed interest in the token and a potential shift in market sentiment, readings from BTT’s price charts hint at a correction in the near term.
BitTorrent Lacks the Bullish Momentum to Extend Rally
BTT’s price has climbed by 4% over the past 24 hours. As of this writing, the altcoin sits at $0.00000111, with a rising trading volume.
However, despite the price uptick, BTT’s Aroon Up Line is currently at 0%, indicating that the uptrend lacks a strong momentum. An asset’s Aroon Indicator measures the strength and direction of a trend by evaluating the time since the highest high and the lowest low over a specified period.

When an asset’s price rallies while the Aroon Up Line is at 0%, it indicates that while the price is trending higher, there has not been strong bullish momentum in recent times. The Aroon Up indicator measures how recently an asset has made a new high within a certain time frame. A value of 0% shows that the asset’s price has not reached a new high in the specified period.
BTT’s Moving Average Convergence Divergence (MACD) supports this bearish outlook. As of this writing, the token’s MACD line (blue) rests significantly below its signal line (orange).
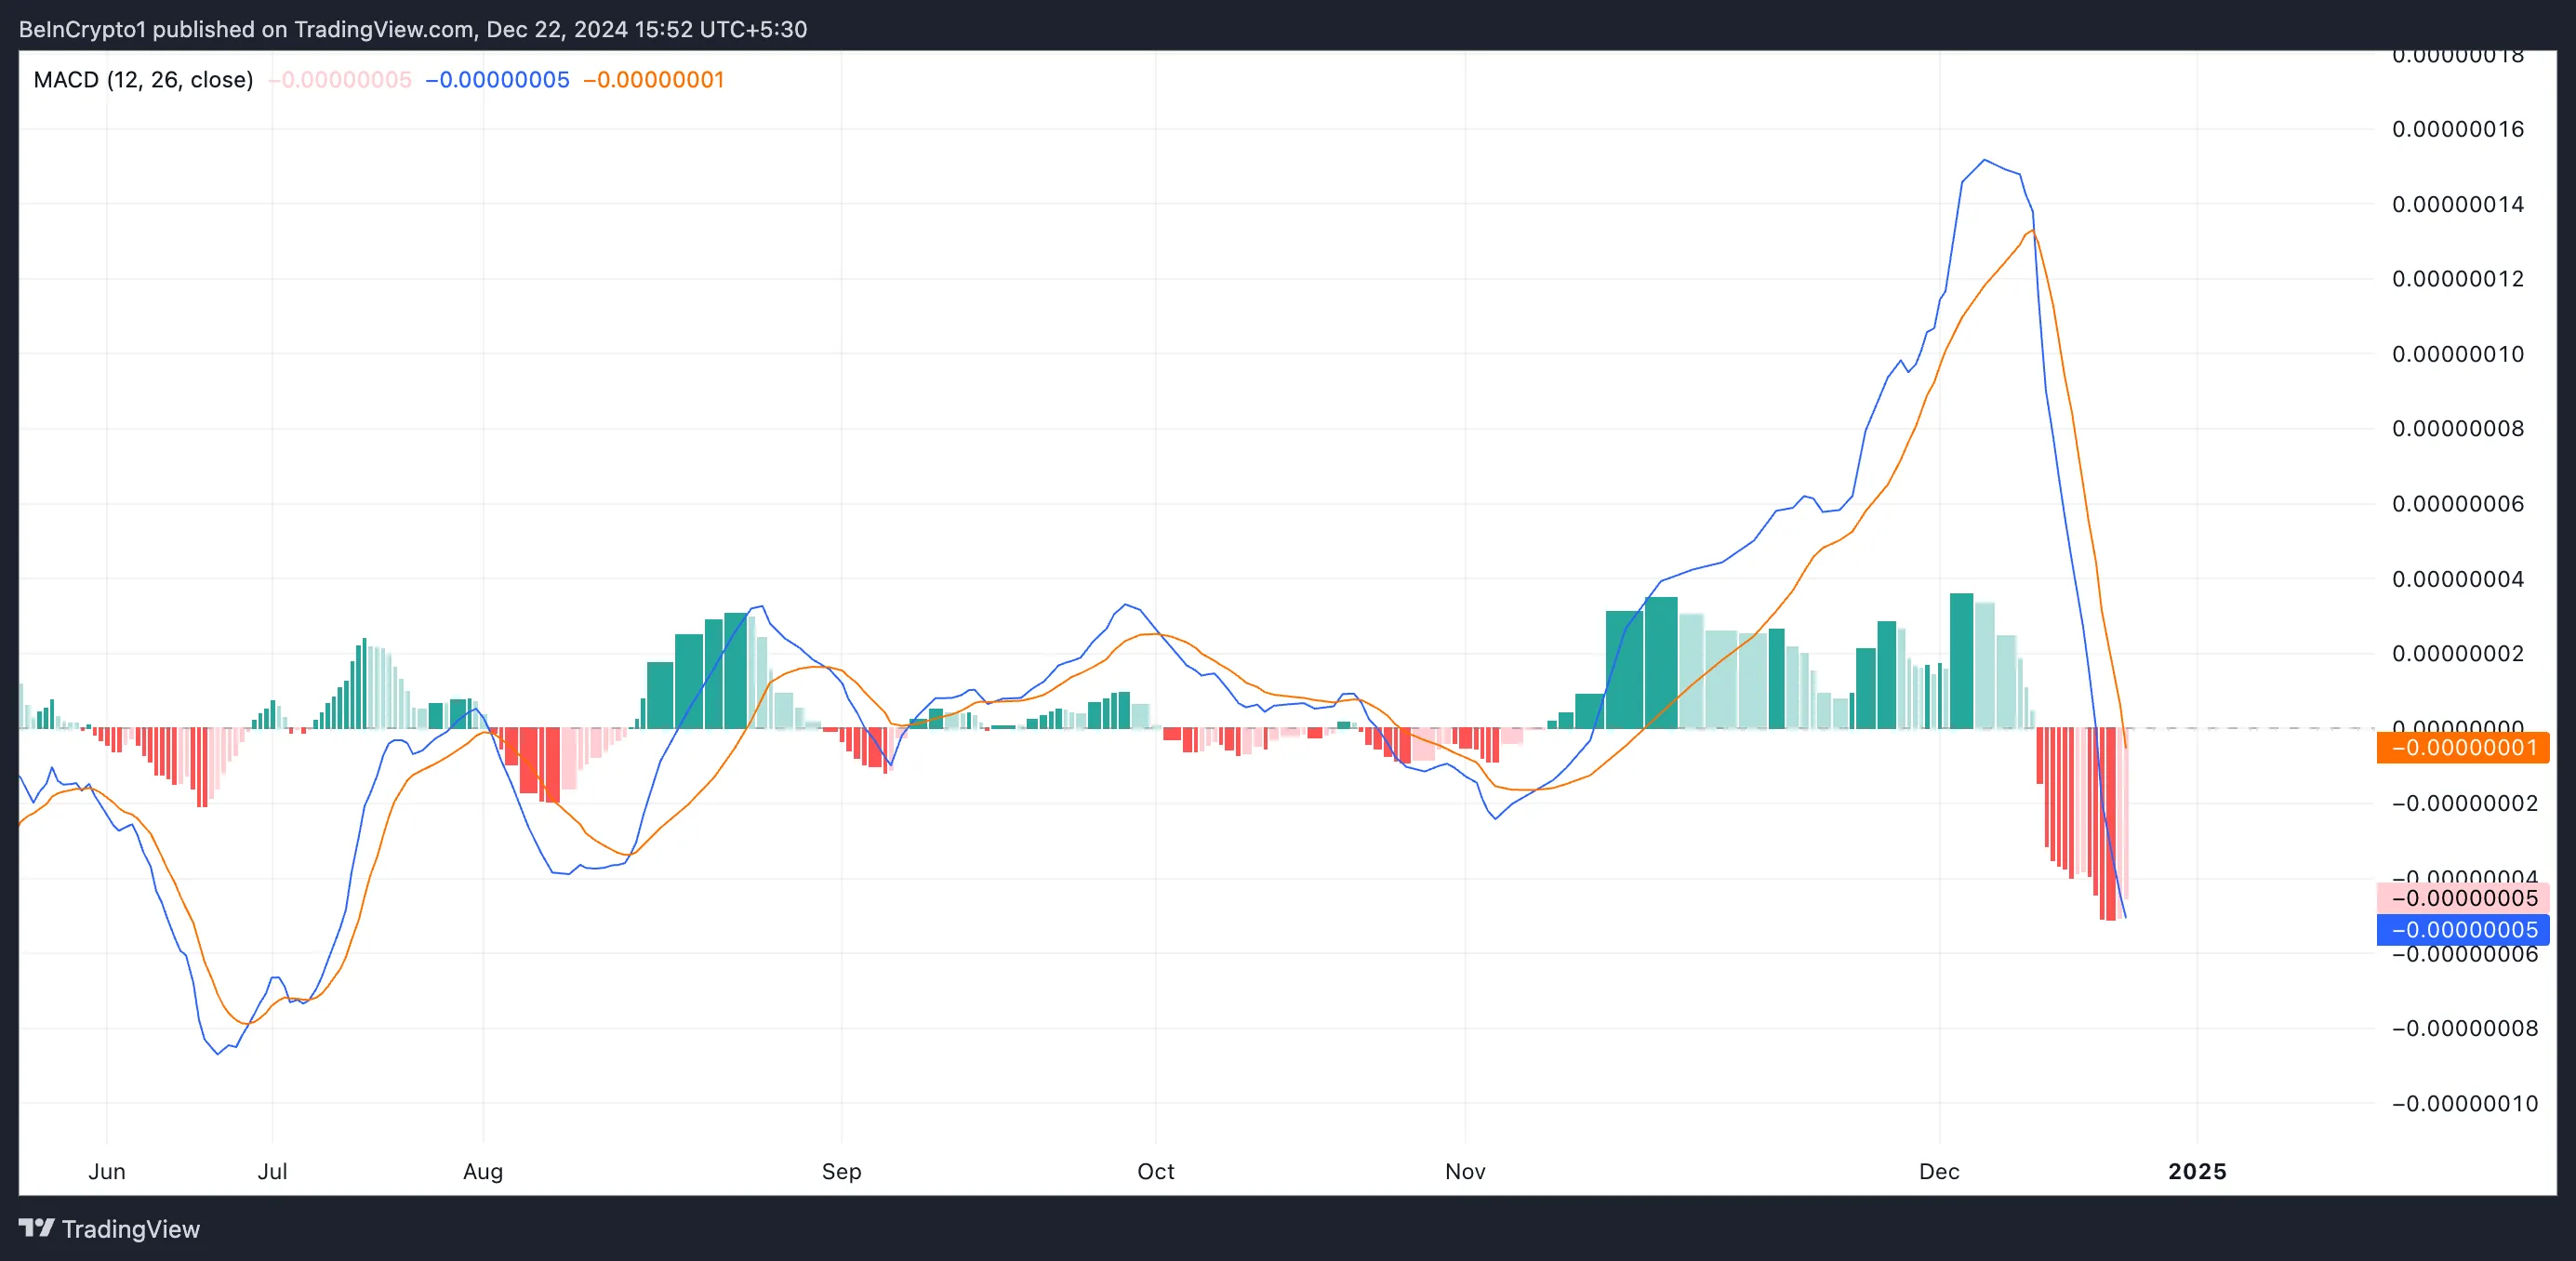
An asset’s MACD indicator identifies trends and momentum in its price movement. It helps traders spot potential buy or sell signals through crossovers between the MACD and signal lines. As in BTT’s case, when the MACD line is below the signal line, it indicates a bullish bearish, suggesting that the asset’s price may drop. Traders often see this crossover as a potential sell signal.
BTT Price Prediction: Token Eyes Crucial Support, But Bulls Could Push for Further Gains
According to the daily chart, BTT is currently trading above critical support at $0.00000093. If selloffs intensify, the token’s price could test this level. If the bears overpower the bulls, BTT may extend its decline and plummet to $0.00000067, a low it last reached in August.
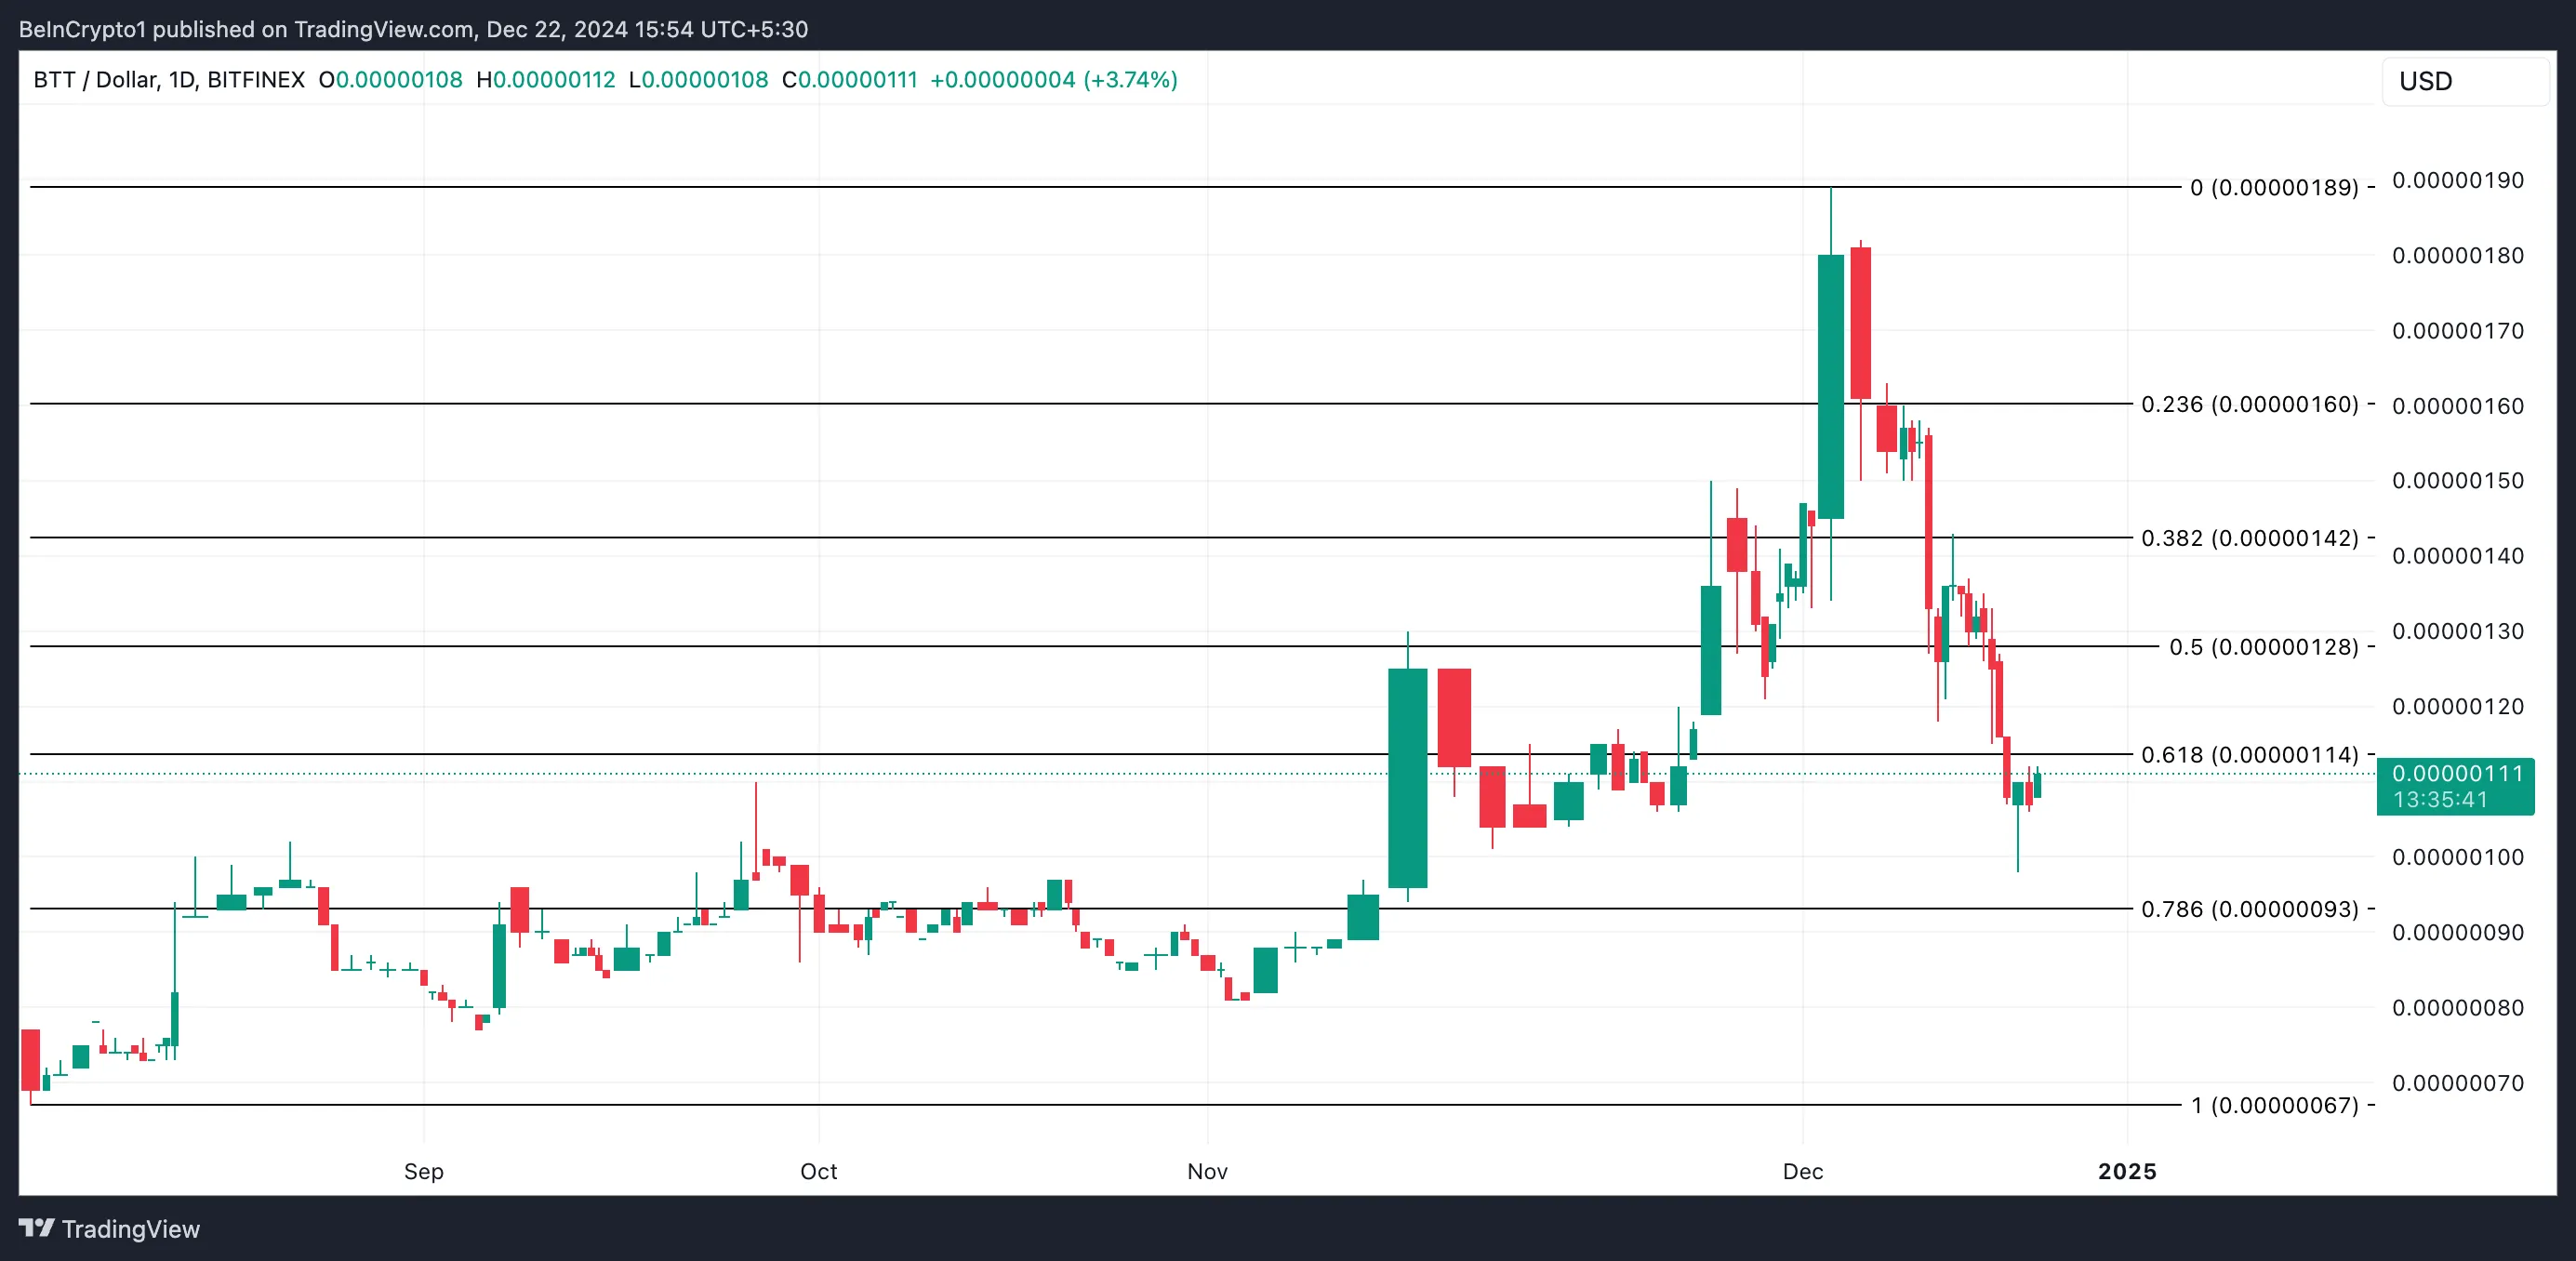
On the other hand, if buying pressure strengthens, BTT may continue its upward trend and break above resistance at $0.00000114. A successful breach of this level could help the token reclaim $0.00000128.
免責聲明:投資有風險,本文並非投資建議,以上內容不應被視為任何金融產品的購買或出售要約、建議或邀請,作者或其他用戶的任何相關討論、評論或帖子也不應被視為此類內容。本文僅供一般參考,不考慮您的個人投資目標、財務狀況或需求。TTM對信息的準確性和完整性不承擔任何責任或保證,投資者應自行研究並在投資前尋求專業建議。
熱議股票
- 1
- 2
- 3
- 4
- 5
- 6
- 7
- 8
- 9
- 10