Hedera (HBAR) Price Aims for $12 Billion Market Cap as Momentum Builds
- Hedera (HBAR) price surges 121% in 30 days, aiming to reclaim a $12 billion market cap amid strong bullish momentum.
- ADX at 29.35 confirms a strengthening uptrend, while Ichimoku Cloud signals sustained positive sentiment and buyer control.
- Key resistance at $0.33 may pave the way to $0.378, while $0.27 remains critical support in case of a pullback.
Hedera (HBAR) price has surged significantly, reaching its highest levels in three years this December while attempting to reclaim its $12 billion market cap.
Over the past 30 days, HBAR has risen an impressive 121%, driven by strong bullish momentum and key technical patterns like the recent golden cross. Indicators such as the ADX and Ichimoku Cloud suggest a strengthening uptrend, with buyers maintaining control and the potential for further gains.
Hedera Current Uptrend is Getting Stronger
HBAR Average Directional Index (ADX) currently stands at 29.35, marking a significant rise from 15 just two days ago. This sharp increase reflects strengthening trend momentum, confirming that the current uptrend is gaining traction.
The rise in ADX indicates that HBAR price recent bullish action is supported by a solid trend. That suggest that buyers are firmly in control of the market.
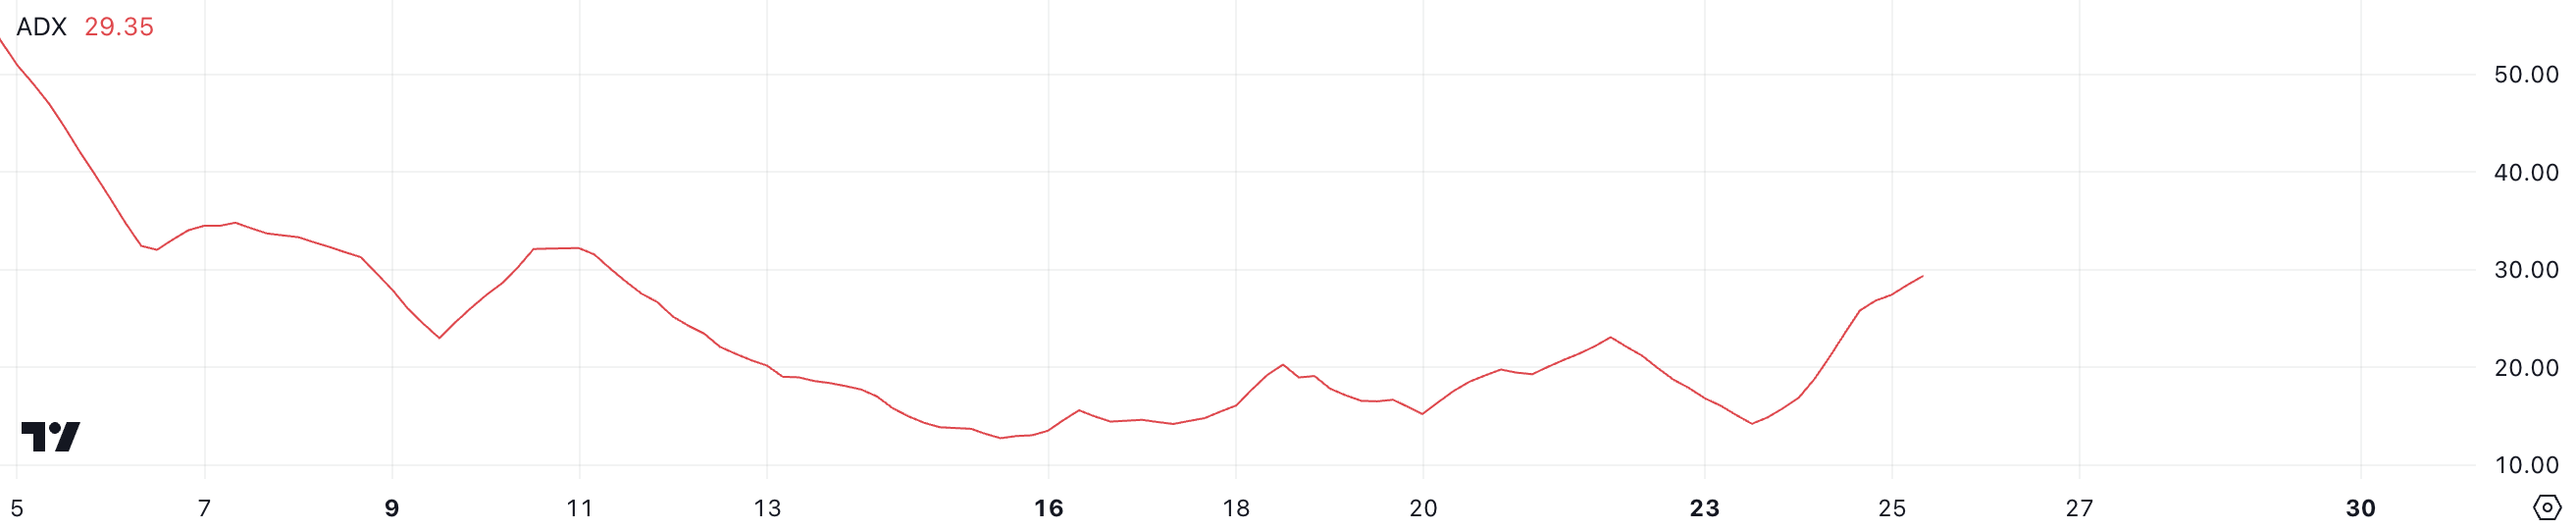
ADX is a widely used trend strength indicator that measures the intensity of a trend without specifying its direction, on a scale from 0 to 100. Values below 20 suggest a weak or absent trend, while values above 25 indicate a strong trend.
With HBAR’s ADX at 29.35, the token’s ongoing uptrend is considered strong. That implies the potential for continued upward movement in the short term.
Ichimoku Cloud Shows a Bullish Scenario for Hedera
The Ichimoku Cloud chart for Hedera shows a strengthening bullish trend. The price has broken above the cloud (green and red shaded areas), signaling positive momentum.
The blue conversion line (Tenkan-sen) remains above the red baseline (Kijun-sen), further confirming the bullish sentiment. This alignment indicates that buyers are currently in control, and the upward trend may continue if the price stays above the cloud.
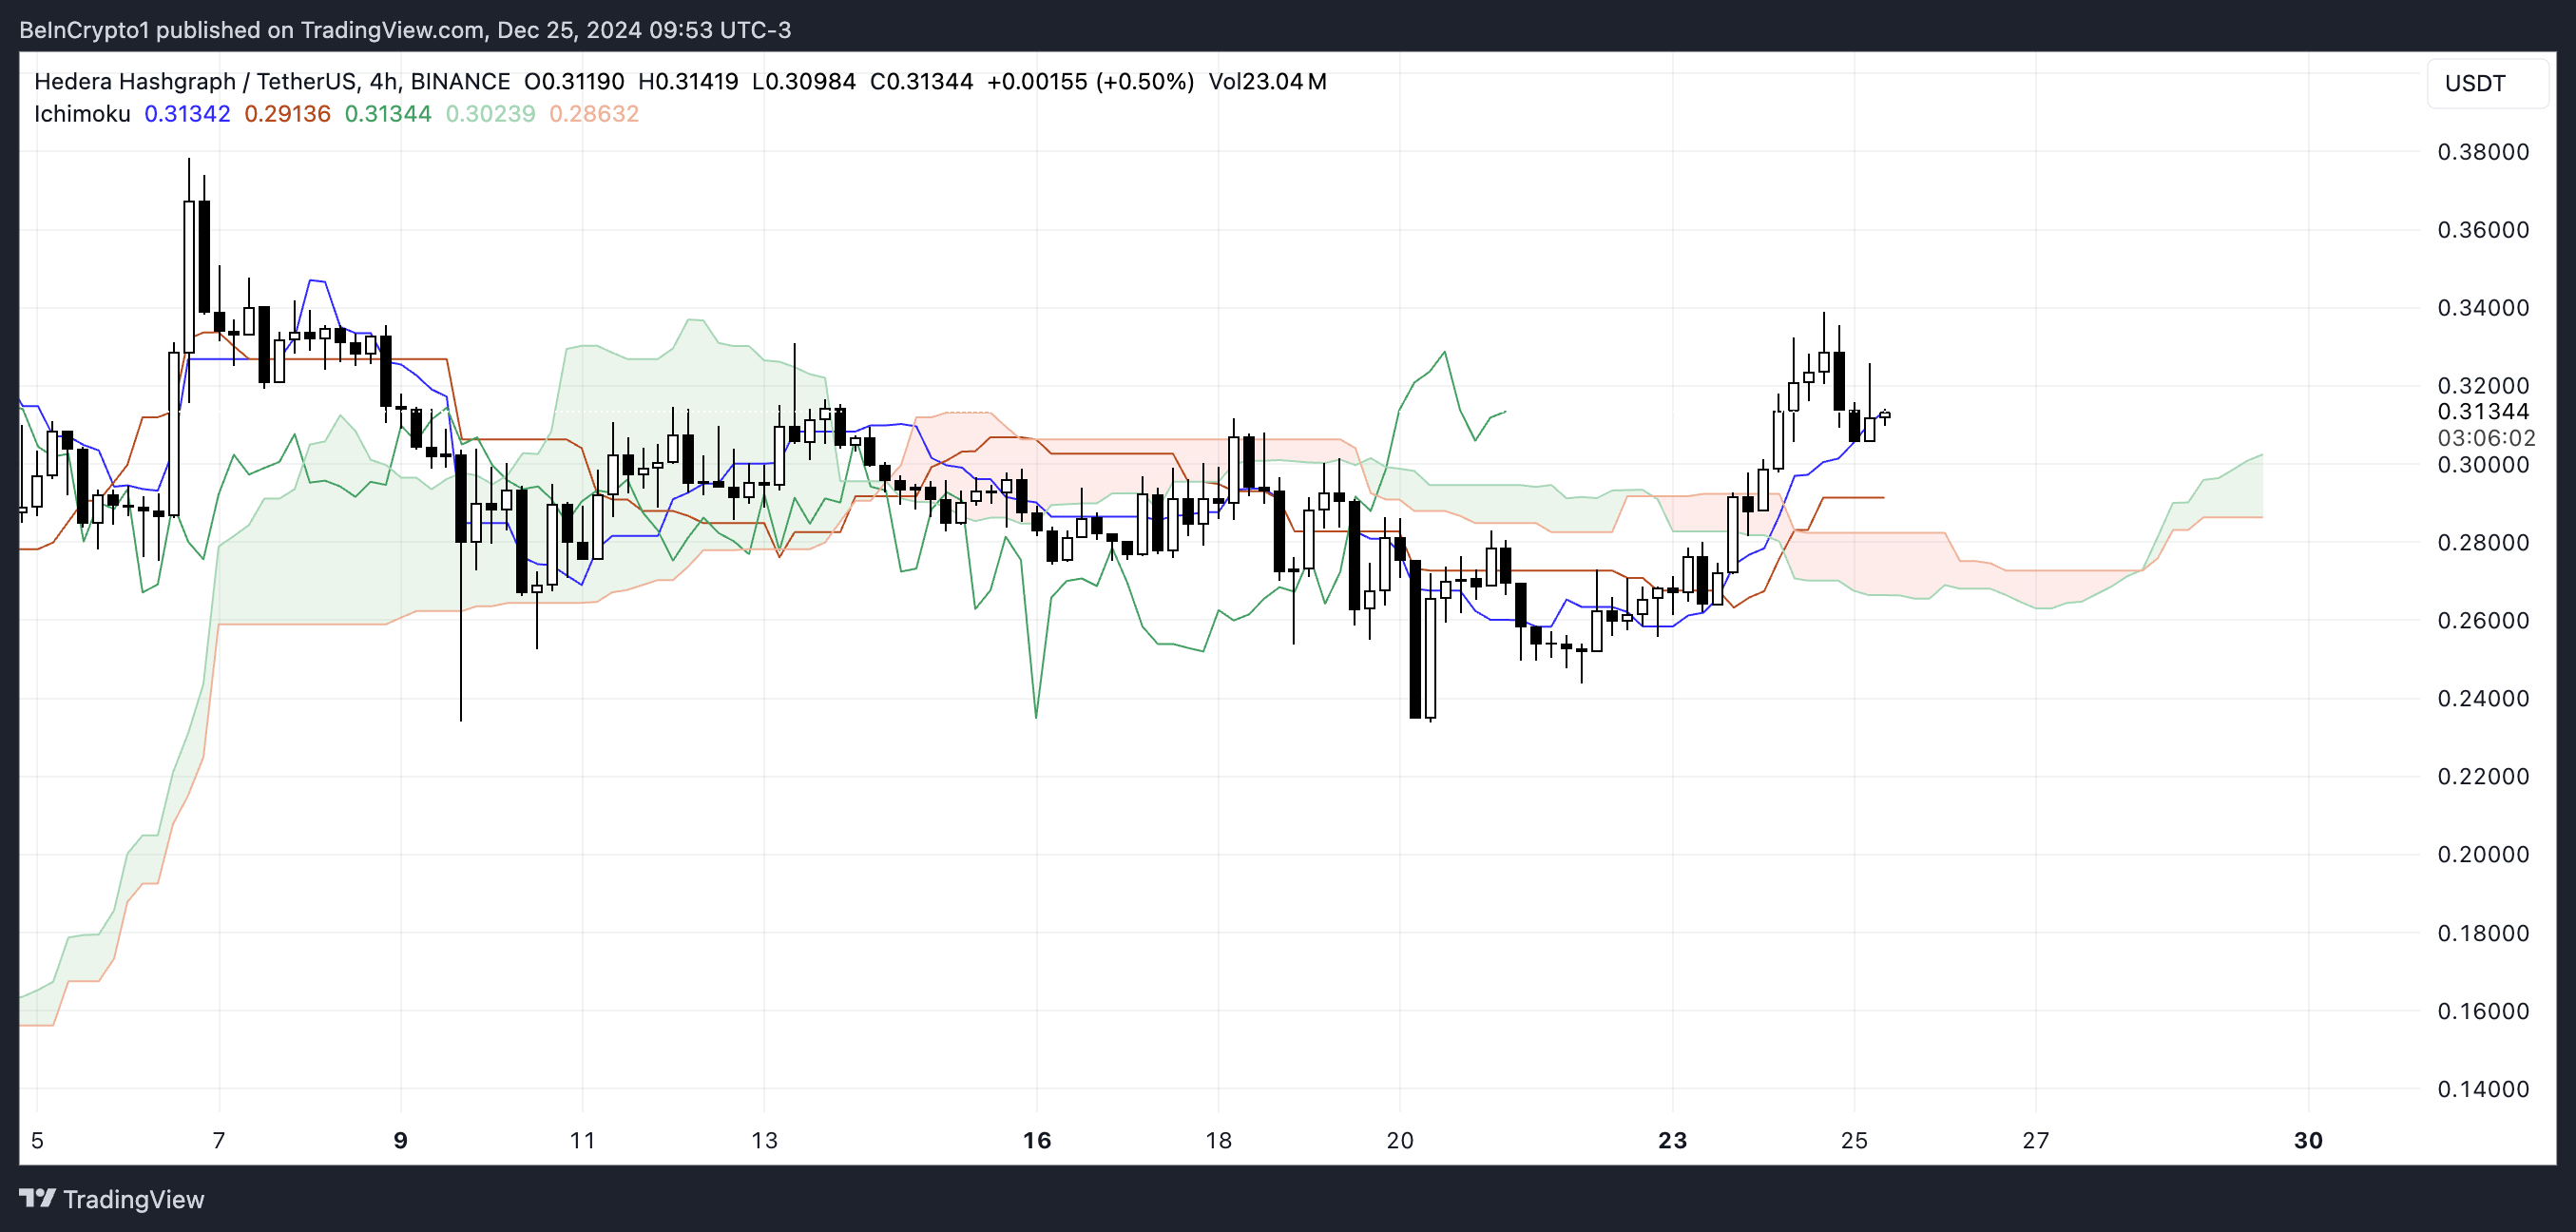
Additionally, the lagging span (green line) is positioned above both the price and the cloud, reinforcing the bullish outlook. The future cloud (green) also projects upward momentum, with the leading span A (green boundary) higher than span B (red boundary), suggesting that the Hedera bullish trend could persist.
These Ichimoku signals highlight a strong trend, and unless there is a significant reversal, HBAR price may continue its upward trajectory in the short term.
HBAR Price Prediction: Will HBAR Test $0.37 Soon?
HBAR recently formed a golden cross on December 24, with the short-term EMA crossing above the long-term EMA, signaling a potential bullish trend reversal.
This classic bullish pattern indicates increasing upward momentum, and the next significant resistance lies at $0.33. If this resistance is broken, HBAR price could gain further traction and rise to test $0.378.
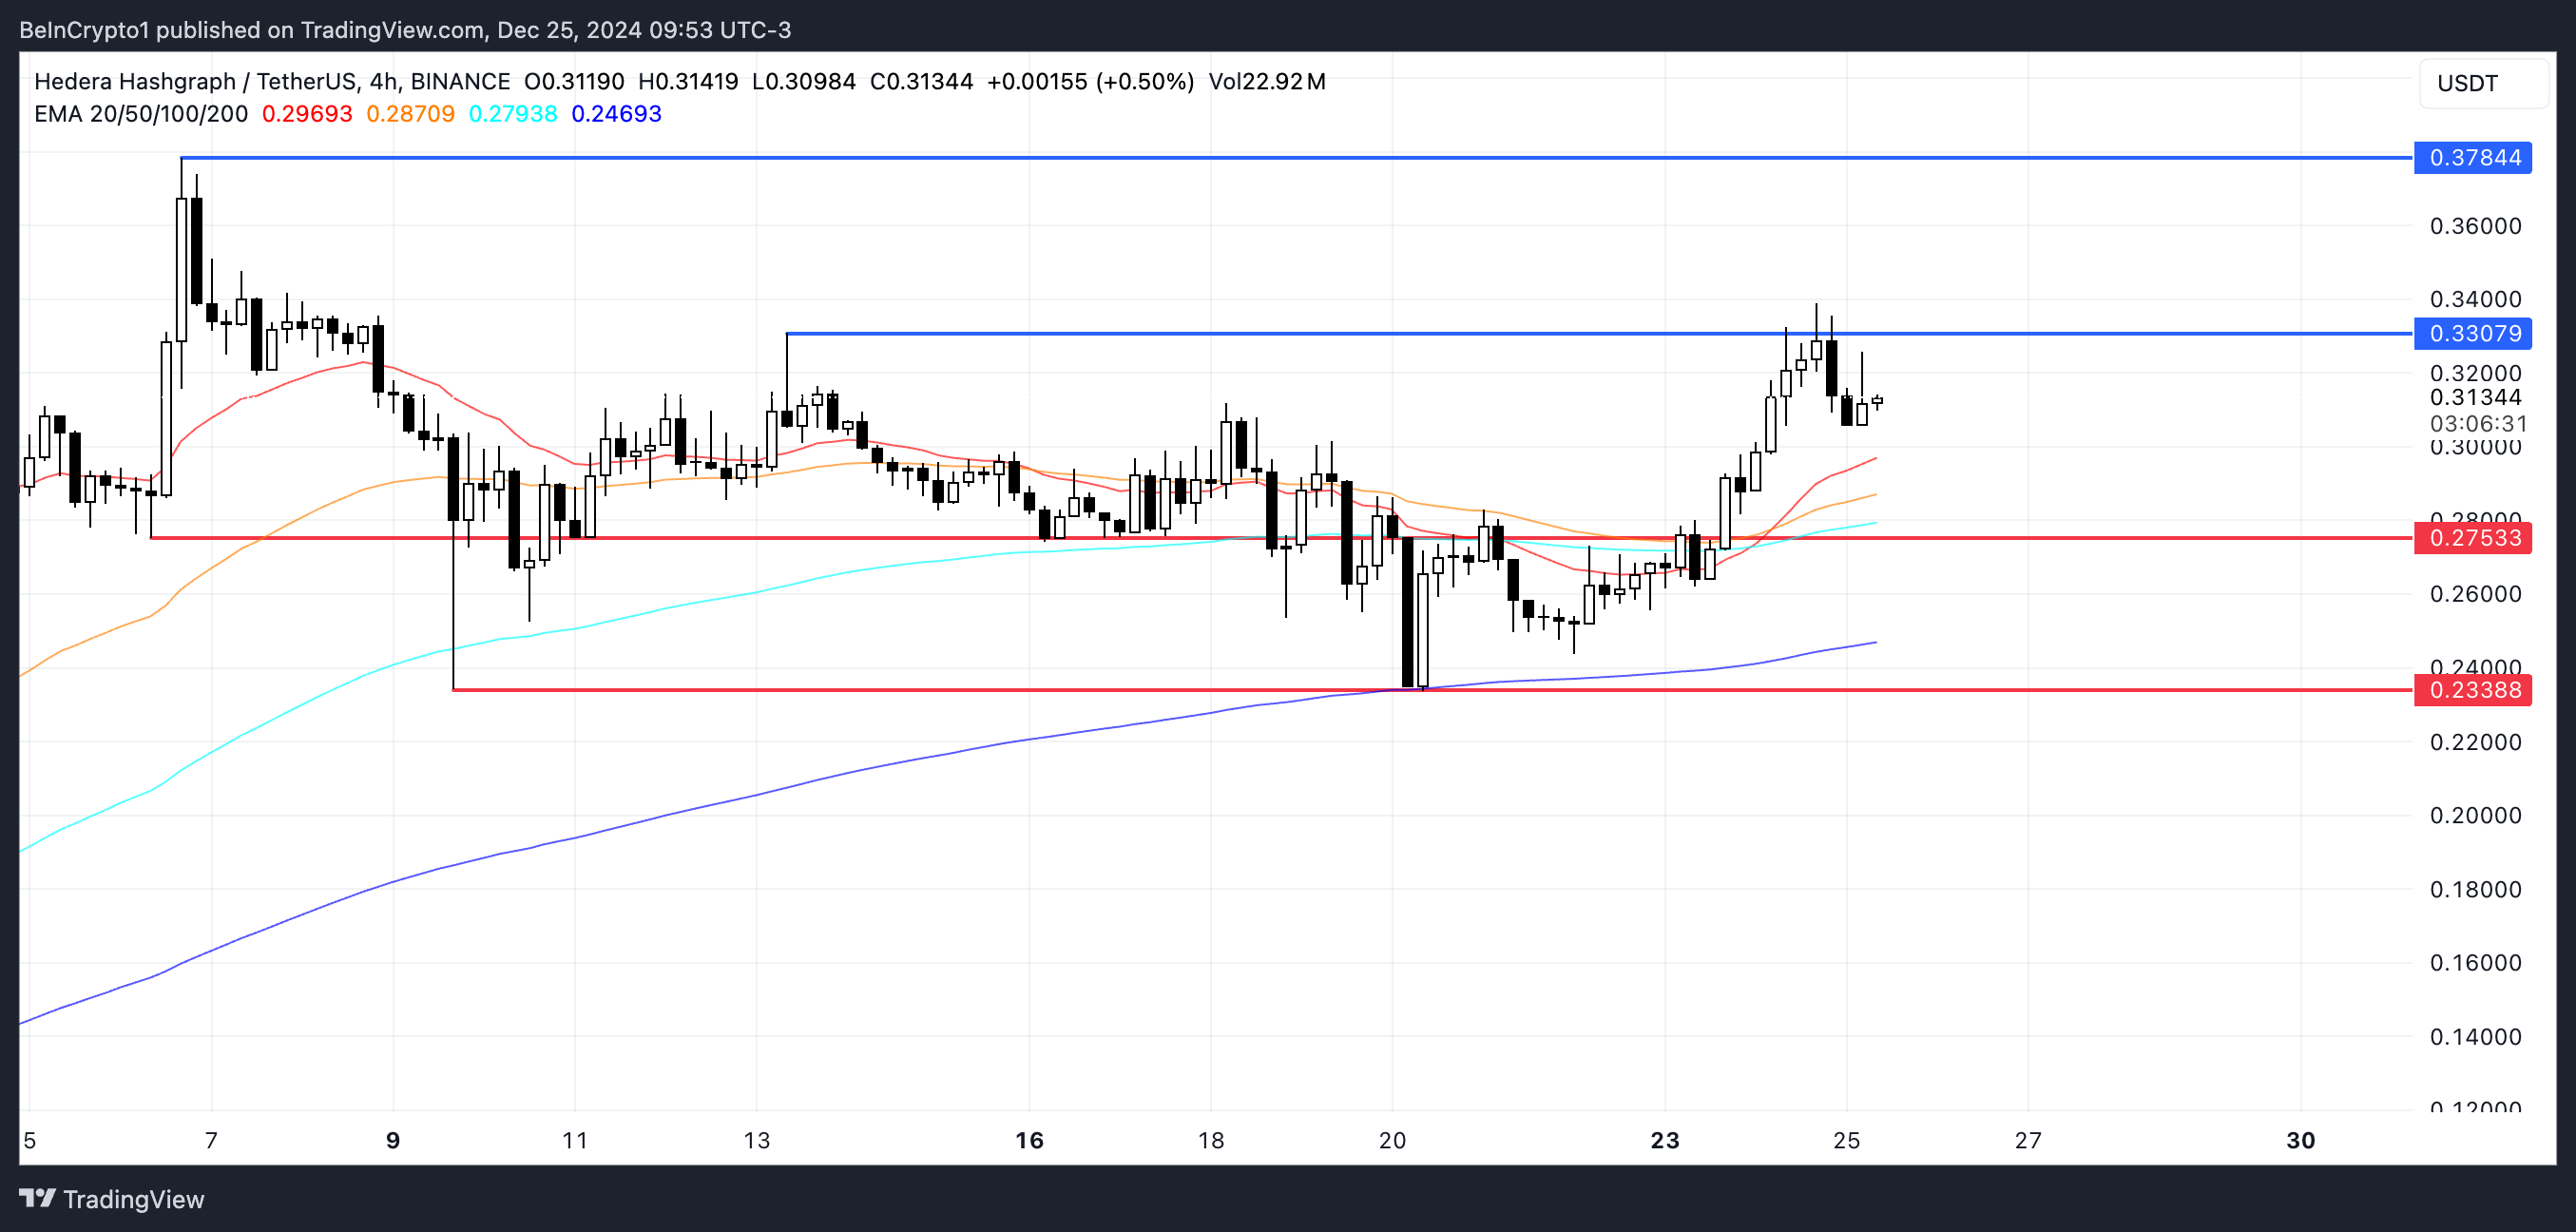
However, if the uptrend begins to lose momentum, Hedera price may face a pullback, testing the support level at $0.27.
Should this support fail to hold, the price could decline further to $0.23, erasing much of the recent gains.
免責聲明:投資有風險,本文並非投資建議,以上內容不應被視為任何金融產品的購買或出售要約、建議或邀請,作者或其他用戶的任何相關討論、評論或帖子也不應被視為此類內容。本文僅供一般參考,不考慮您的個人投資目標、財務狀況或需求。TTM對信息的準確性和完整性不承擔任何責任或保證,投資者應自行研究並在投資前尋求專業建議。
熱議股票
- 1
- 2
- 3
- 4
- 5
- 6
- 7
- 8
- 9
- 10