Hewlett Packard Enterprise Company's (NYSE:HPE) Stock Has Shown A Decent Performance: Have Financials A Role To Play?
Hewlett Packard Enterprise's (NYSE:HPE) stock up by 8.7% over the past three months. We wonder if and what role the company's financials play in that price change as a company's long-term fundamentals usually dictate market outcomes. Specifically, we decided to study Hewlett Packard Enterprise's ROE in this article.
Return on equity or ROE is a key measure used to assess how efficiently a company's management is utilizing the company's capital. In short, ROE shows the profit each dollar generates with respect to its shareholder investments.
See our latest analysis for Hewlett Packard Enterprise
How Do You Calculate Return On Equity?
The formula for return on equity is:
Return on Equity = Net Profit (from continuing operations) ÷ Shareholders' Equity
So, based on the above formula, the ROE for Hewlett Packard Enterprise is:
10% = US$2.6b ÷ US$25b (Based on the trailing twelve months to October 2024).
The 'return' is the profit over the last twelve months. Another way to think of that is that for every $1 worth of equity, the company was able to earn $0.10 in profit.
What Is The Relationship Between ROE And Earnings Growth?
So far, we've learned that ROE is a measure of a company's profitability. We now need to evaluate how much profit the company reinvests or "retains" for future growth which then gives us an idea about the growth potential of the company. Generally speaking, other things being equal, firms with a high return on equity and profit retention, have a higher growth rate than firms that don’t share these attributes.
Hewlett Packard Enterprise's Earnings Growth And 10% ROE
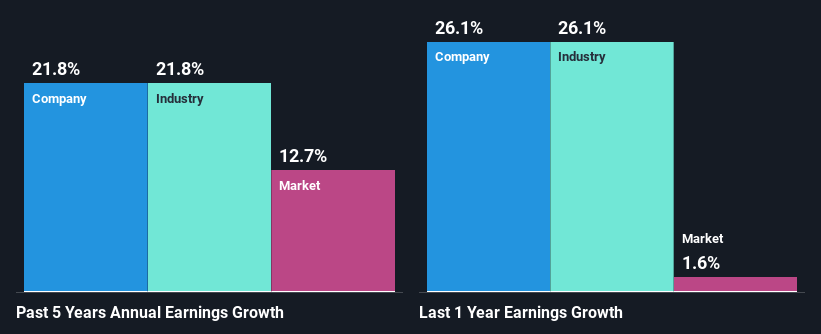
At first glance, Hewlett Packard Enterprise's ROE doesn't look very promising. Yet, a closer study shows that the company's ROE is similar to the industry average of 9.2%. Moreover, we are quite pleased to see that Hewlett Packard Enterprise's net income grew significantly at a rate of 22% over the last five years. Considering the moderately low ROE, it is quite possible that there might be some other aspects that are positively influencing the company's earnings growth. For instance, the company has a low payout ratio or is being managed efficiently.
Next, on comparing Hewlett Packard Enterprise's net income growth with the industry, we found that the company's reported growth is similar to the industry average growth rate of 22% over the last few years.
Earnings growth is an important metric to consider when valuing a stock. The investor should try to establish if the expected growth or decline in earnings, whichever the case may be, is priced in. By doing so, they will have an idea if the stock is headed into clear blue waters or if swampy waters await. Has the market priced in the future outlook for HPE? You can find out in our latest intrinsic value infographic research report.
Is Hewlett Packard Enterprise Making Efficient Use Of Its Profits?
The three-year median payout ratio for Hewlett Packard Enterprise is 33%, which is moderately low. The company is retaining the remaining 67%. This suggests that its dividend is well covered, and given the high growth we discussed above, it looks like Hewlett Packard Enterprise is reinvesting its earnings efficiently.
Moreover, Hewlett Packard Enterprise is determined to keep sharing its profits with shareholders which we infer from its long history of nine years of paying a dividend. Our latest analyst data shows that the future payout ratio of the company is expected to drop to 25% over the next three years. Despite the lower expected payout ratio, the company's ROE is not expected to change by much.
Summary
In total, it does look like Hewlett Packard Enterprise has some positive aspects to its business. Even in spite of the low rate of return, the company has posted impressive earnings growth as a result of reinvesting heavily into its business. Having said that, the company's earnings growth is expected to slow down, as forecasted in the current analyst estimates. To know more about the latest analysts predictions for the company, check out this visualization of analyst forecasts for the company.
Valuation is complex, but we're here to simplify it.
Discover if Hewlett Packard Enterprise might be undervalued or overvalued with our detailed analysis, featuring fair value estimates, potential risks, dividends, insider trades, and its financial condition.
Access Free AnalysisHave feedback on this article? Concerned about the content? Get in touch with us directly. Alternatively, email editorial-team (at) simplywallst.com.This article by Simply Wall St is general in nature. We provide commentary based on historical data and analyst forecasts only using an unbiased methodology and our articles are not intended to be financial advice. It does not constitute a recommendation to buy or sell any stock, and does not take account of your objectives, or your financial situation. We aim to bring you long-term focused analysis driven by fundamental data. Note that our analysis may not factor in the latest price-sensitive company announcements or qualitative material. Simply Wall St has no position in any stocks mentioned.
免責聲明:投資有風險,本文並非投資建議,以上內容不應被視為任何金融產品的購買或出售要約、建議或邀請,作者或其他用戶的任何相關討論、評論或帖子也不應被視為此類內容。本文僅供一般參考,不考慮您的個人投資目標、財務狀況或需求。TTM對信息的準確性和完整性不承擔任何責任或保證,投資者應自行研究並在投資前尋求專業建議。
熱議股票
- 1
- 2
- 3
- 4
- 5
- 6
- 7
- 8
- 9
- 10