Ethena (ENA) Gains 11% Amid Strong Momentum: Key Levels to Watch
- Ethena (ENA) price surges 11%, driven by strong technicals, with CMF hitting 0.36, signaling robust capital inflows.
- ADX rises to 25.6, confirming a strong uptrend; +DI dominance highlights growing buying momentum over selling pressure.
- ENA could test $1.22 resistance and climb to $1.32 if momentum holds; failure at $1.12 support may lead to a deeper correction.
Ethena (ENA) price has surged over 11% in the last 24 hours, bringing its market cap to $3.5 billion.
This rally is supported by strong technical indicators, including a recent golden cross and a sharp rise in its Chaikin Money Flow (CMF) to 0.36, signaling increased buying pressure.
ENA CMF Reached Its Highest Level Since November
The Chaikin Money Flow (CMF) for Ethena currently sits at 0.36, showing a significant increase from nearly 0 just two days ago. This sharp rise reflects a substantial improvement in capital inflows, indicating that buying pressure has strengthened over the short term.
The CMF is a momentum indicator that measures the flow of money into and out of an asset based on price and volume. Values above 0 suggest net buying pressure, and values below 0 indicate net selling pressure.
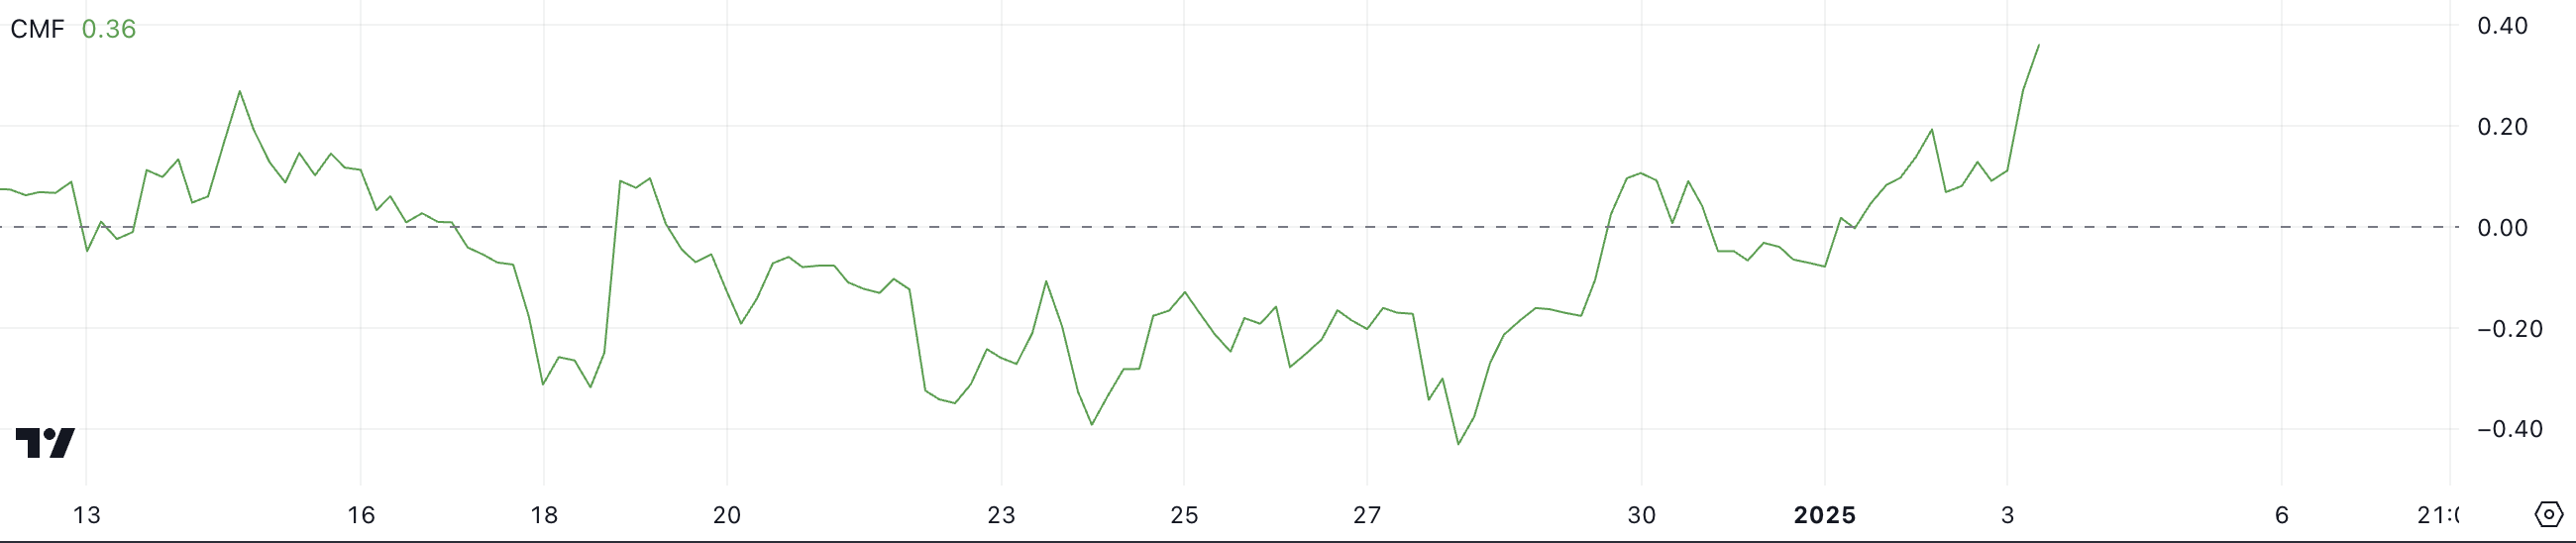
With a CMF of 0.36, ENA signals strong positive momentum, suggesting that investors are actively accumulating the token. This could indicate growing confidence in Ethena potential for price appreciation, as increased capital inflows often support upward price movement.
If the CMF maintains its upward trajectory, ENA price could experience sustained growth in the near term, provided buying pressure continues to outweigh selling activity. However, any decline in the CMF could signal a loss of momentum, potentially leading to consolidation or a pullback.
Ethena DMI Shows a Strong Uptrend
Ethena DMI chart reveals that its ADX has surged to 25.6, a significant increase from 9.9 just two days ago, signaling a strong uptick in trend strength. The ADX, or Average Directional Index, measures the strength of a trend on a scale from 0 to 100.
Readings above 25 indicate a strong trend, while values below 20 suggest weak or absent momentum. With the ADX now firmly above the 25 threshold, it confirms that ENA price is experiencing a strong trend, aligning with its current uptrend.
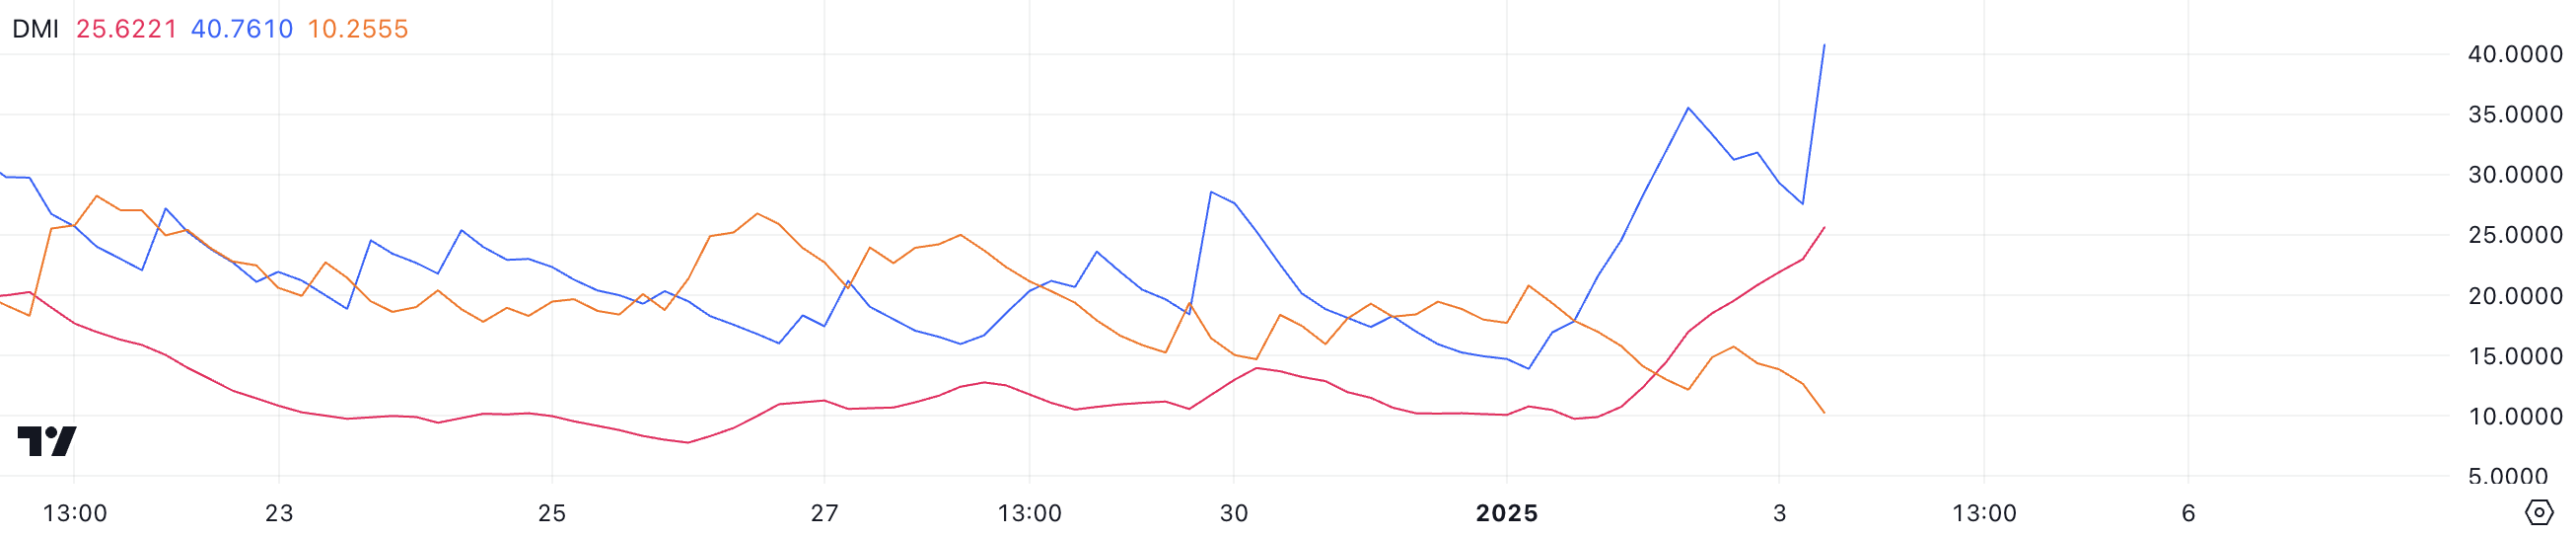
The directional indicators further highlight the dominance of bullish momentum. The +DI has risen sharply to 42.1, reflecting strong buying pressure, while the -DI remains at a much lower 9.9, signaling minimal selling activity. This configuration indicates that buyers are firmly in control, driving the price upward with significant strength.
In the short term, these DMI readings suggest that ENA’s uptrend is likely to continue. However, sustained gains will depend on the ADX maintaining its upward trajectory and the +DI retaining its dominance over the -DI.
ENA Price Prediction: Will Ethena Rise 13.7% Next?
ENA’s EMA lines have recently formed a golden cross, a bullish signal that occurs when short-term moving averages cross above long-term ones. This development indicates a potential shift in momentum toward sustained upward price action.
If the current uptrend persists, ENA price could test the resistance at $1.22. A breakout above this level could drive the price higher to $1.32, representing a possible 13.7% upside.
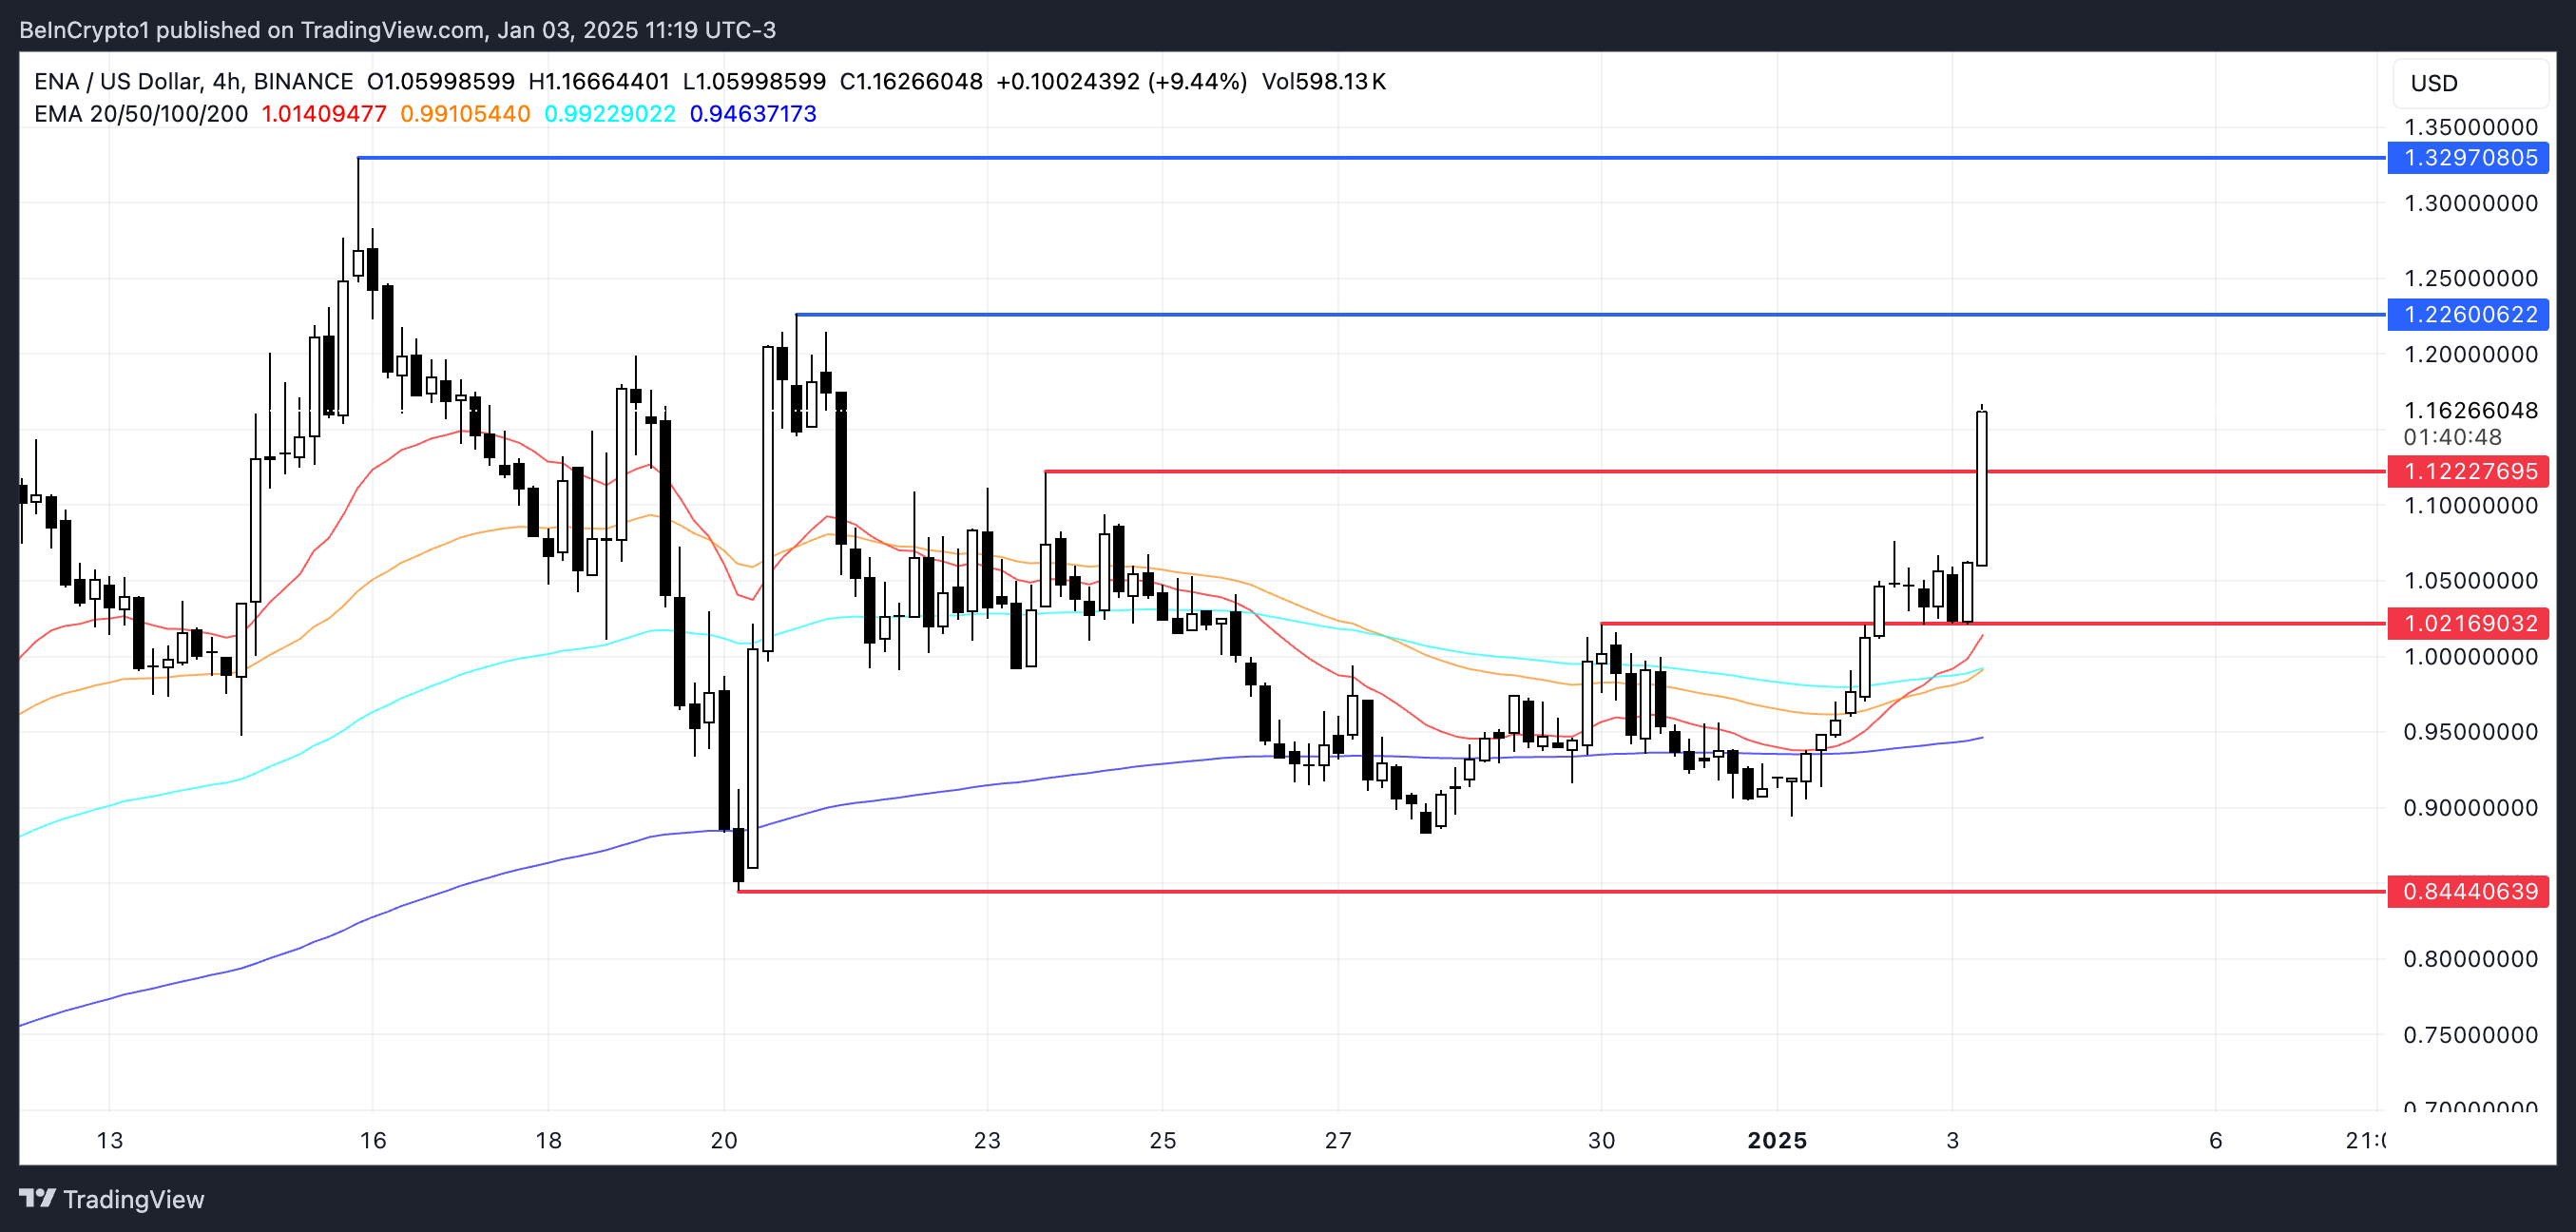
However, if the uptrend falters and bearish momentum takes over, the support at $1.12 will be critical in preventing further declines.
A break below this level could trigger additional selling pressure, pushing ENA price down to $1.02. Should the $1 level fail to provide sufficient support, the price could drop further to $0.84, marking a significant correction.
免責聲明:投資有風險,本文並非投資建議,以上內容不應被視為任何金融產品的購買或出售要約、建議或邀請,作者或其他用戶的任何相關討論、評論或帖子也不應被視為此類內容。本文僅供一般參考,不考慮您的個人投資目標、財務狀況或需求。TTM對信息的準確性和完整性不承擔任何責任或保證,投資者應自行研究並在投資前尋求專業建議。
熱議股票
- 1
- 2
- 3
- 4
- 5
- 6
- 7
- 8
- 9
- 10