Is National Fuel Gas Company's (NYSE:NFG) Recent Stock Performance Influenced By Its Financials In Any Way?
National Fuel Gas' (NYSE:NFG) stock is up by 4.0% over the past three months. As most would know, long-term fundamentals have a strong correlation with market price movements, so we decided to look at the company's key financial indicators today to determine if they have any role to play in the recent price movement. Particularly, we will be paying attention to National Fuel Gas' ROE today.
Return on Equity or ROE is a test of how effectively a company is growing its value and managing investors’ money. In other words, it is a profitability ratio which measures the rate of return on the capital provided by the company's shareholders.
View our latest analysis for National Fuel Gas
How Is ROE Calculated?
ROE can be calculated by using the formula:
Return on Equity = Net Profit (from continuing operations) ÷ Shareholders' Equity
So, based on the above formula, the ROE for National Fuel Gas is:
2.7% = US$78m ÷ US$2.8b (Based on the trailing twelve months to September 2024).
The 'return' is the yearly profit. That means that for every $1 worth of shareholders' equity, the company generated $0.03 in profit.
What Has ROE Got To Do With Earnings Growth?
We have already established that ROE serves as an efficient profit-generating gauge for a company's future earnings. We now need to evaluate how much profit the company reinvests or "retains" for future growth which then gives us an idea about the growth potential of the company. Generally speaking, other things being equal, firms with a high return on equity and profit retention, have a higher growth rate than firms that don’t share these attributes.
A Side By Side comparison of National Fuel Gas' Earnings Growth And 2.7% ROE
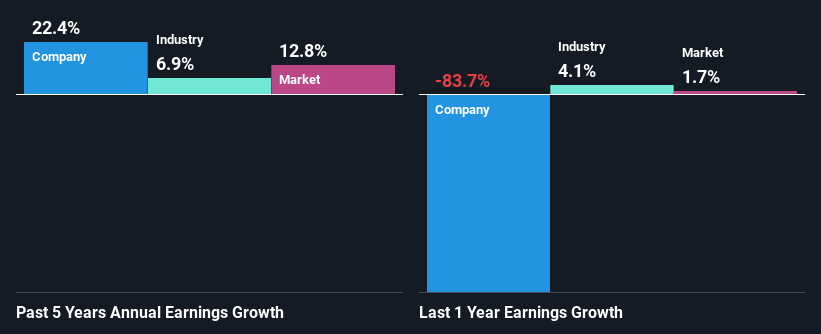
It is hard to argue that National Fuel Gas' ROE is much good in and of itself. Even compared to the average industry ROE of 8.0%, the company's ROE is quite dismal. In spite of this, National Fuel Gas was able to grow its net income considerably, at a rate of 22% in the last five years. Therefore, there could be other reasons behind this growth. For example, it is possible that the company's management has made some good strategic decisions, or that the company has a low payout ratio.
As a next step, we compared National Fuel Gas' net income growth with the industry, and pleasingly, we found that the growth seen by the company is higher than the average industry growth of 6.9%.
Earnings growth is an important metric to consider when valuing a stock. What investors need to determine next is if the expected earnings growth, or the lack of it, is already built into the share price. Doing so will help them establish if the stock's future looks promising or ominous. Has the market priced in the future outlook for NFG? You can find out in our latest intrinsic value infographic research report.
Is National Fuel Gas Using Its Retained Earnings Effectively?
National Fuel Gas' three-year median payout ratio is a pretty moderate 37%, meaning the company retains 63% of its income. This suggests that its dividend is well covered, and given the high growth we discussed above, it looks like National Fuel Gas is reinvesting its earnings efficiently.
Besides, National Fuel Gas has been paying dividends for at least ten years or more. This shows that the company is committed to sharing profits with its shareholders. Upon studying the latest analysts' consensus data, we found that the company's future payout ratio is expected to drop to 25% over the next three years. Accordingly, the expected drop in the payout ratio explains the expected increase in the company's ROE to 17%, over the same period.
Conclusion
In total, it does look like National Fuel Gas has some positive aspects to its business. Despite its low rate of return, the fact that the company reinvests a very high portion of its profits into its business, no doubt contributed to its high earnings growth. That being so, the latest analyst forecasts show that the company will continue to see an expansion in its earnings. To know more about the company's future earnings growth forecasts take a look at this free report on analyst forecasts for the company to find out more.
Valuation is complex, but we're here to simplify it.
Discover if National Fuel Gas might be undervalued or overvalued with our detailed analysis, featuring fair value estimates, potential risks, dividends, insider trades, and its financial condition.
Access Free AnalysisHave feedback on this article? Concerned about the content? Get in touch with us directly. Alternatively, email editorial-team (at) simplywallst.com.This article by Simply Wall St is general in nature. We provide commentary based on historical data and analyst forecasts only using an unbiased methodology and our articles are not intended to be financial advice. It does not constitute a recommendation to buy or sell any stock, and does not take account of your objectives, or your financial situation. We aim to bring you long-term focused analysis driven by fundamental data. Note that our analysis may not factor in the latest price-sensitive company announcements or qualitative material. Simply Wall St has no position in any stocks mentioned.
免責聲明:投資有風險,本文並非投資建議,以上內容不應被視為任何金融產品的購買或出售要約、建議或邀請,作者或其他用戶的任何相關討論、評論或帖子也不應被視為此類內容。本文僅供一般參考,不考慮您的個人投資目標、財務狀況或需求。TTM對信息的準確性和完整性不承擔任何責任或保證,投資者應自行研究並在投資前尋求專業建議。
熱議股票
- 1
- 2
- 3
- 4
- 5
- 6
- 7
- 8
- 9
- 10