Bitcoin (BTC) Demand Fades as Price Nears $90,000
- Bitcoin faces downward pressure, nearing $90K support amid a selloff. The price has dropped over 8% in the past week.
- Institutional confidence dips as the Smart Money Index falls. Key indicators signal bearish trends and reduced buying activity.
- A veteran trader spots a bearish head-and-shoulders pattern. BTC risks slipping below $90K, with potential support at $85,224.
Bitcoin (BTC) has continued its downward trajectory, trading close to the $90,000 key support amid a persistent market selloff. Its price has declined by over 8% in the past week, raising concerns about further potential declines.
With declining buying pressure and a drop in institutional participation, Bitcoin risks slipping below $90,000 in the near term. Here’s why.
Bitcoin Struggles as Institutional Confidence Wanes
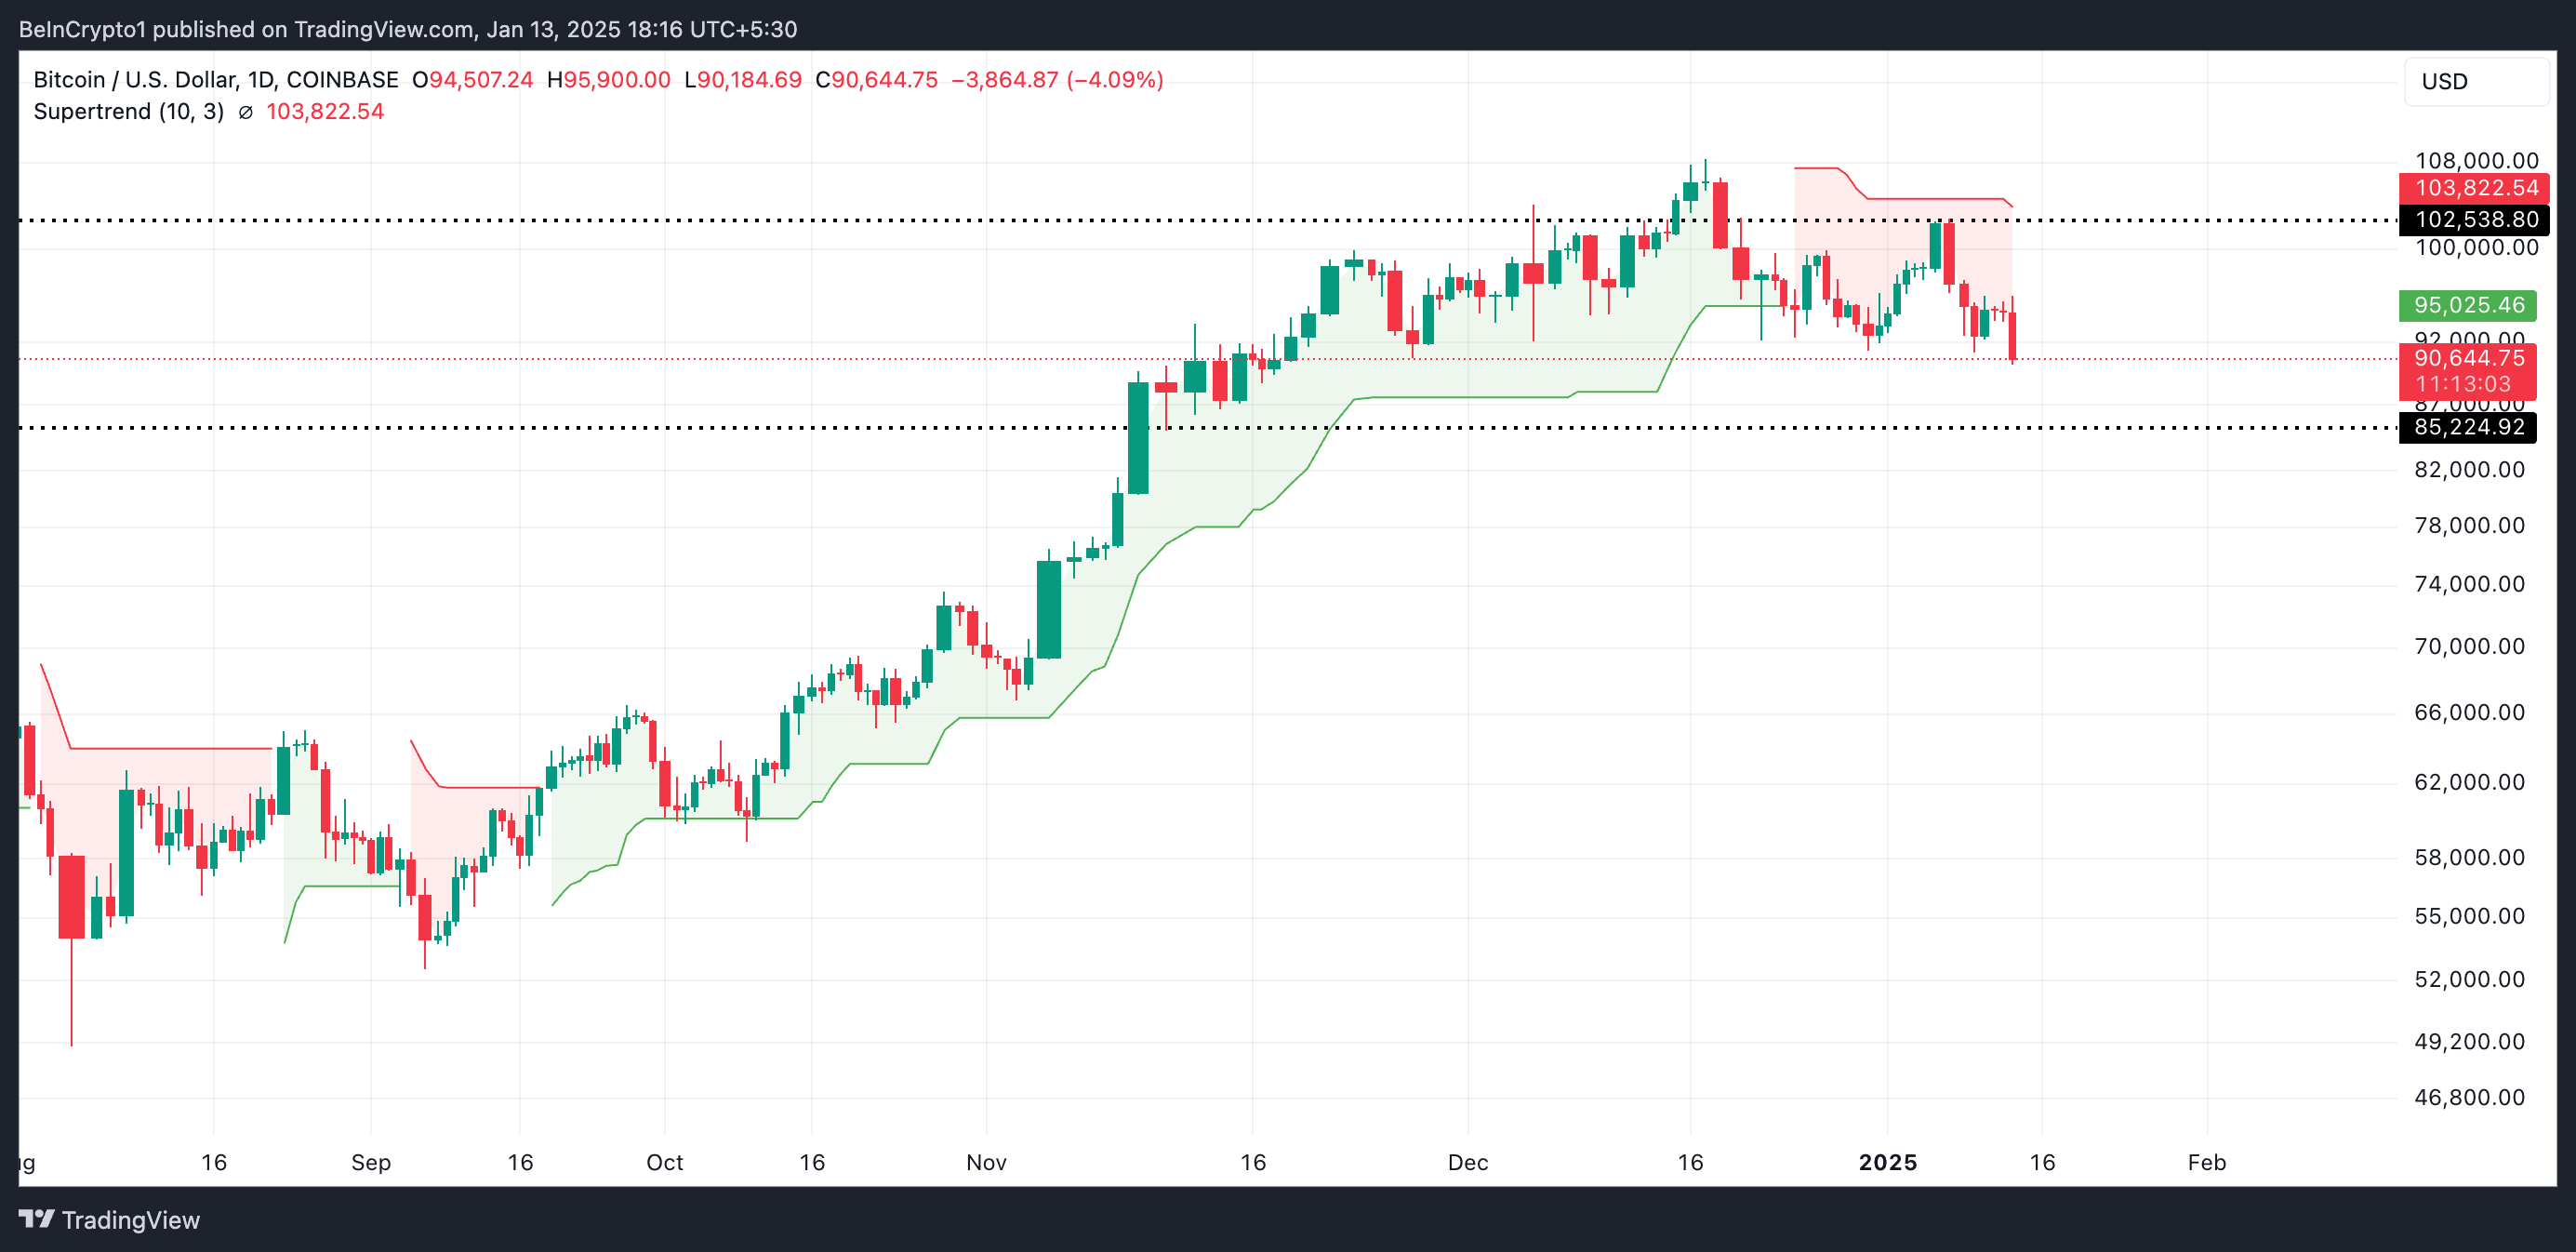
On the BTC/USD one-day chart, BTC trades below the red line of its Super Trend indicator. This indicator tracks the direction and strength of an asset’s price trend. It is displayed as a line on the price chart, changing color to signify the trend: green for an uptrend and red for a downtrend.
When an asset’s price falls below its Super Trend indicator, it signals bearish momentum and a decrease in buying pressure. Traders typically view this as a sell signal or a cautionary warning.
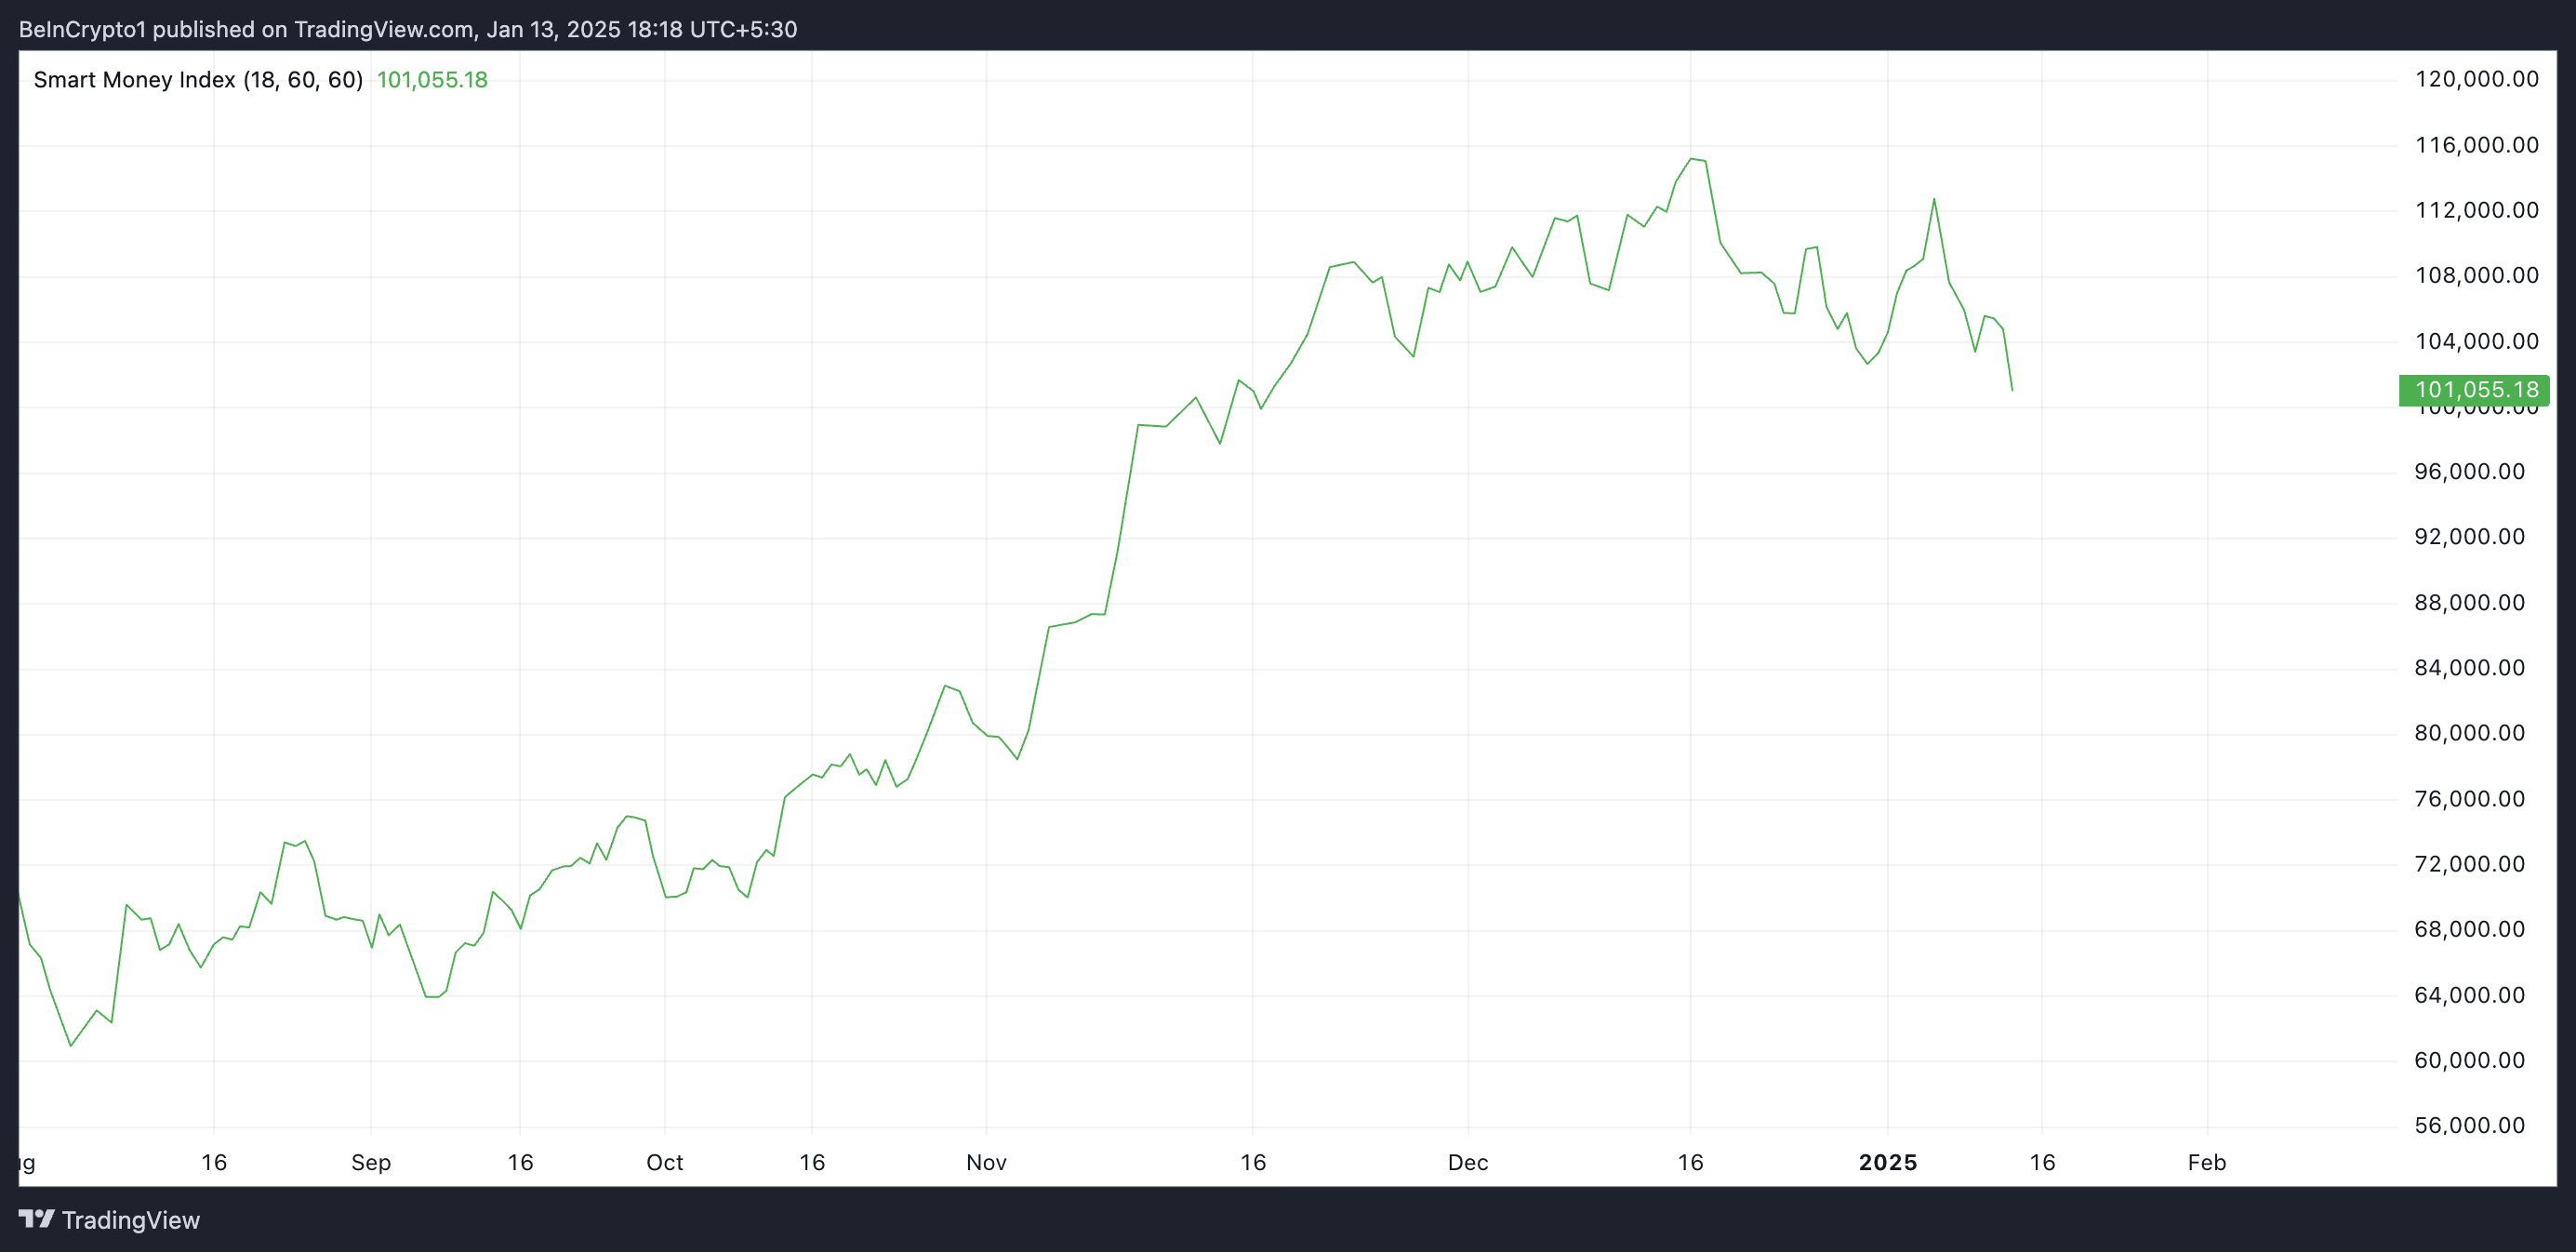
In addition, BTC’s Smart Money Index (SMI) has persistently declined since January 6. As of this writing, the indicator is at 101,055, dipping 10% since then.
An asset’s SMI tracks the activity of experienced or institutional investors by analyzing market behavior during the first and last hours of trading. When the indicator rises, it suggests increased buying activity by these investors, signaling growing confidence in the asset.
On the other hand, a decline in SMI suggests high selling activity and reduced confidence from these investors. This hints at a potential decline in BTC’s price in the near term.
In a recent post on X, veteran crypto trader Peter Brandt confirms this bearish outlook. According to him, an assessment of BTC’s price performance on a one-day chart has revealed the potential formation of a head and shoulders (H&S) top pattern.
A H&S pattern consists of three peaks: the central peak (the “head”) is the highest, flanked by two smaller peaks (the “shoulders”). The line connecting the lowest points of these peaks is called the “neckline.”
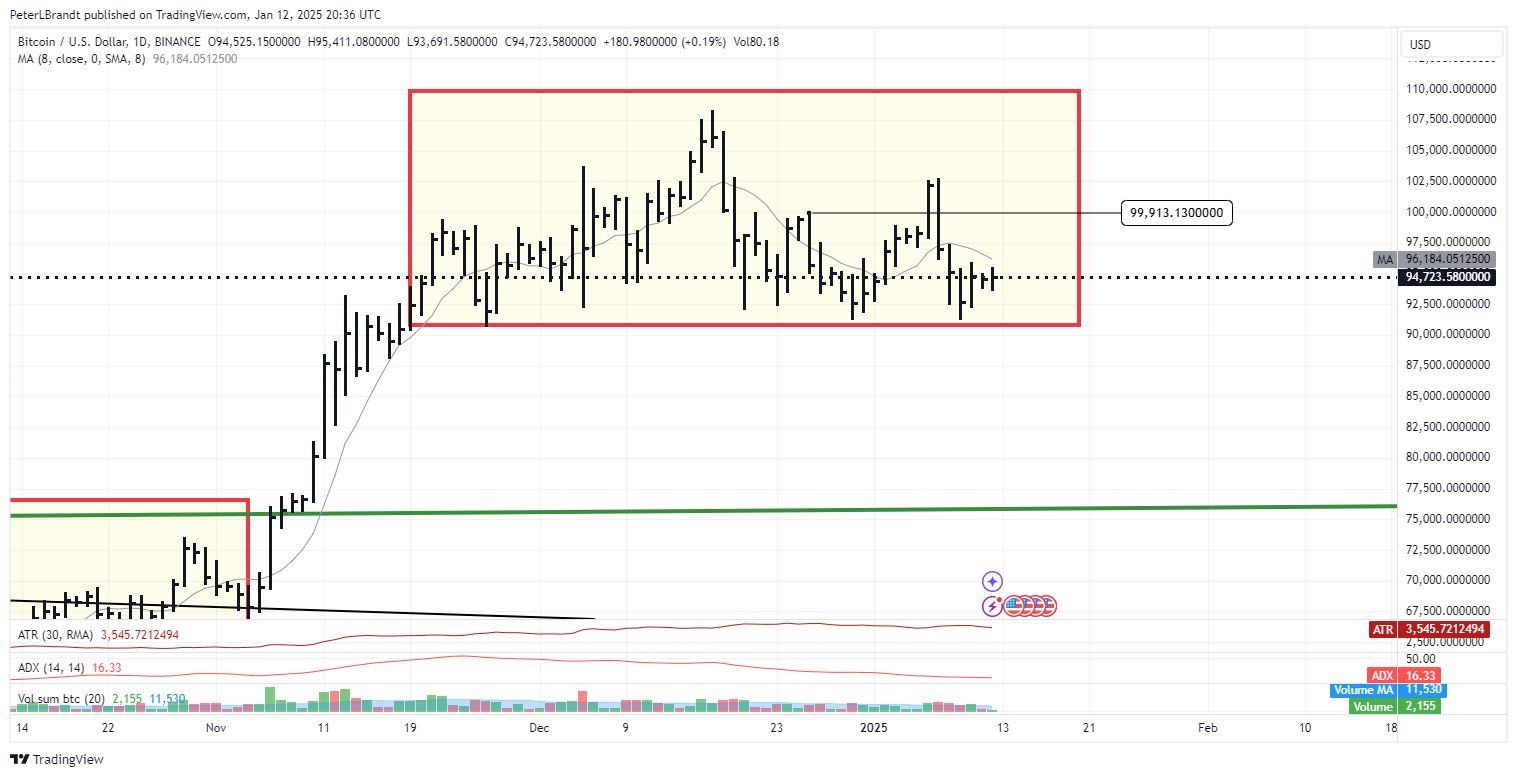
As identified by Brandt, in BTC’s case, one of three things could happen: the H&S pattern could complete and trend toward its target, fail and create a bear trap, or morph into a larger, more complex pattern.
BTC Price Prediction: Bearish Pattern Emerges
BTC’s declining demand suggests the potential confirmation of the trend and a further decline in its price. In this scenario, the coin could fall below $90,000, trading at around $85,224.
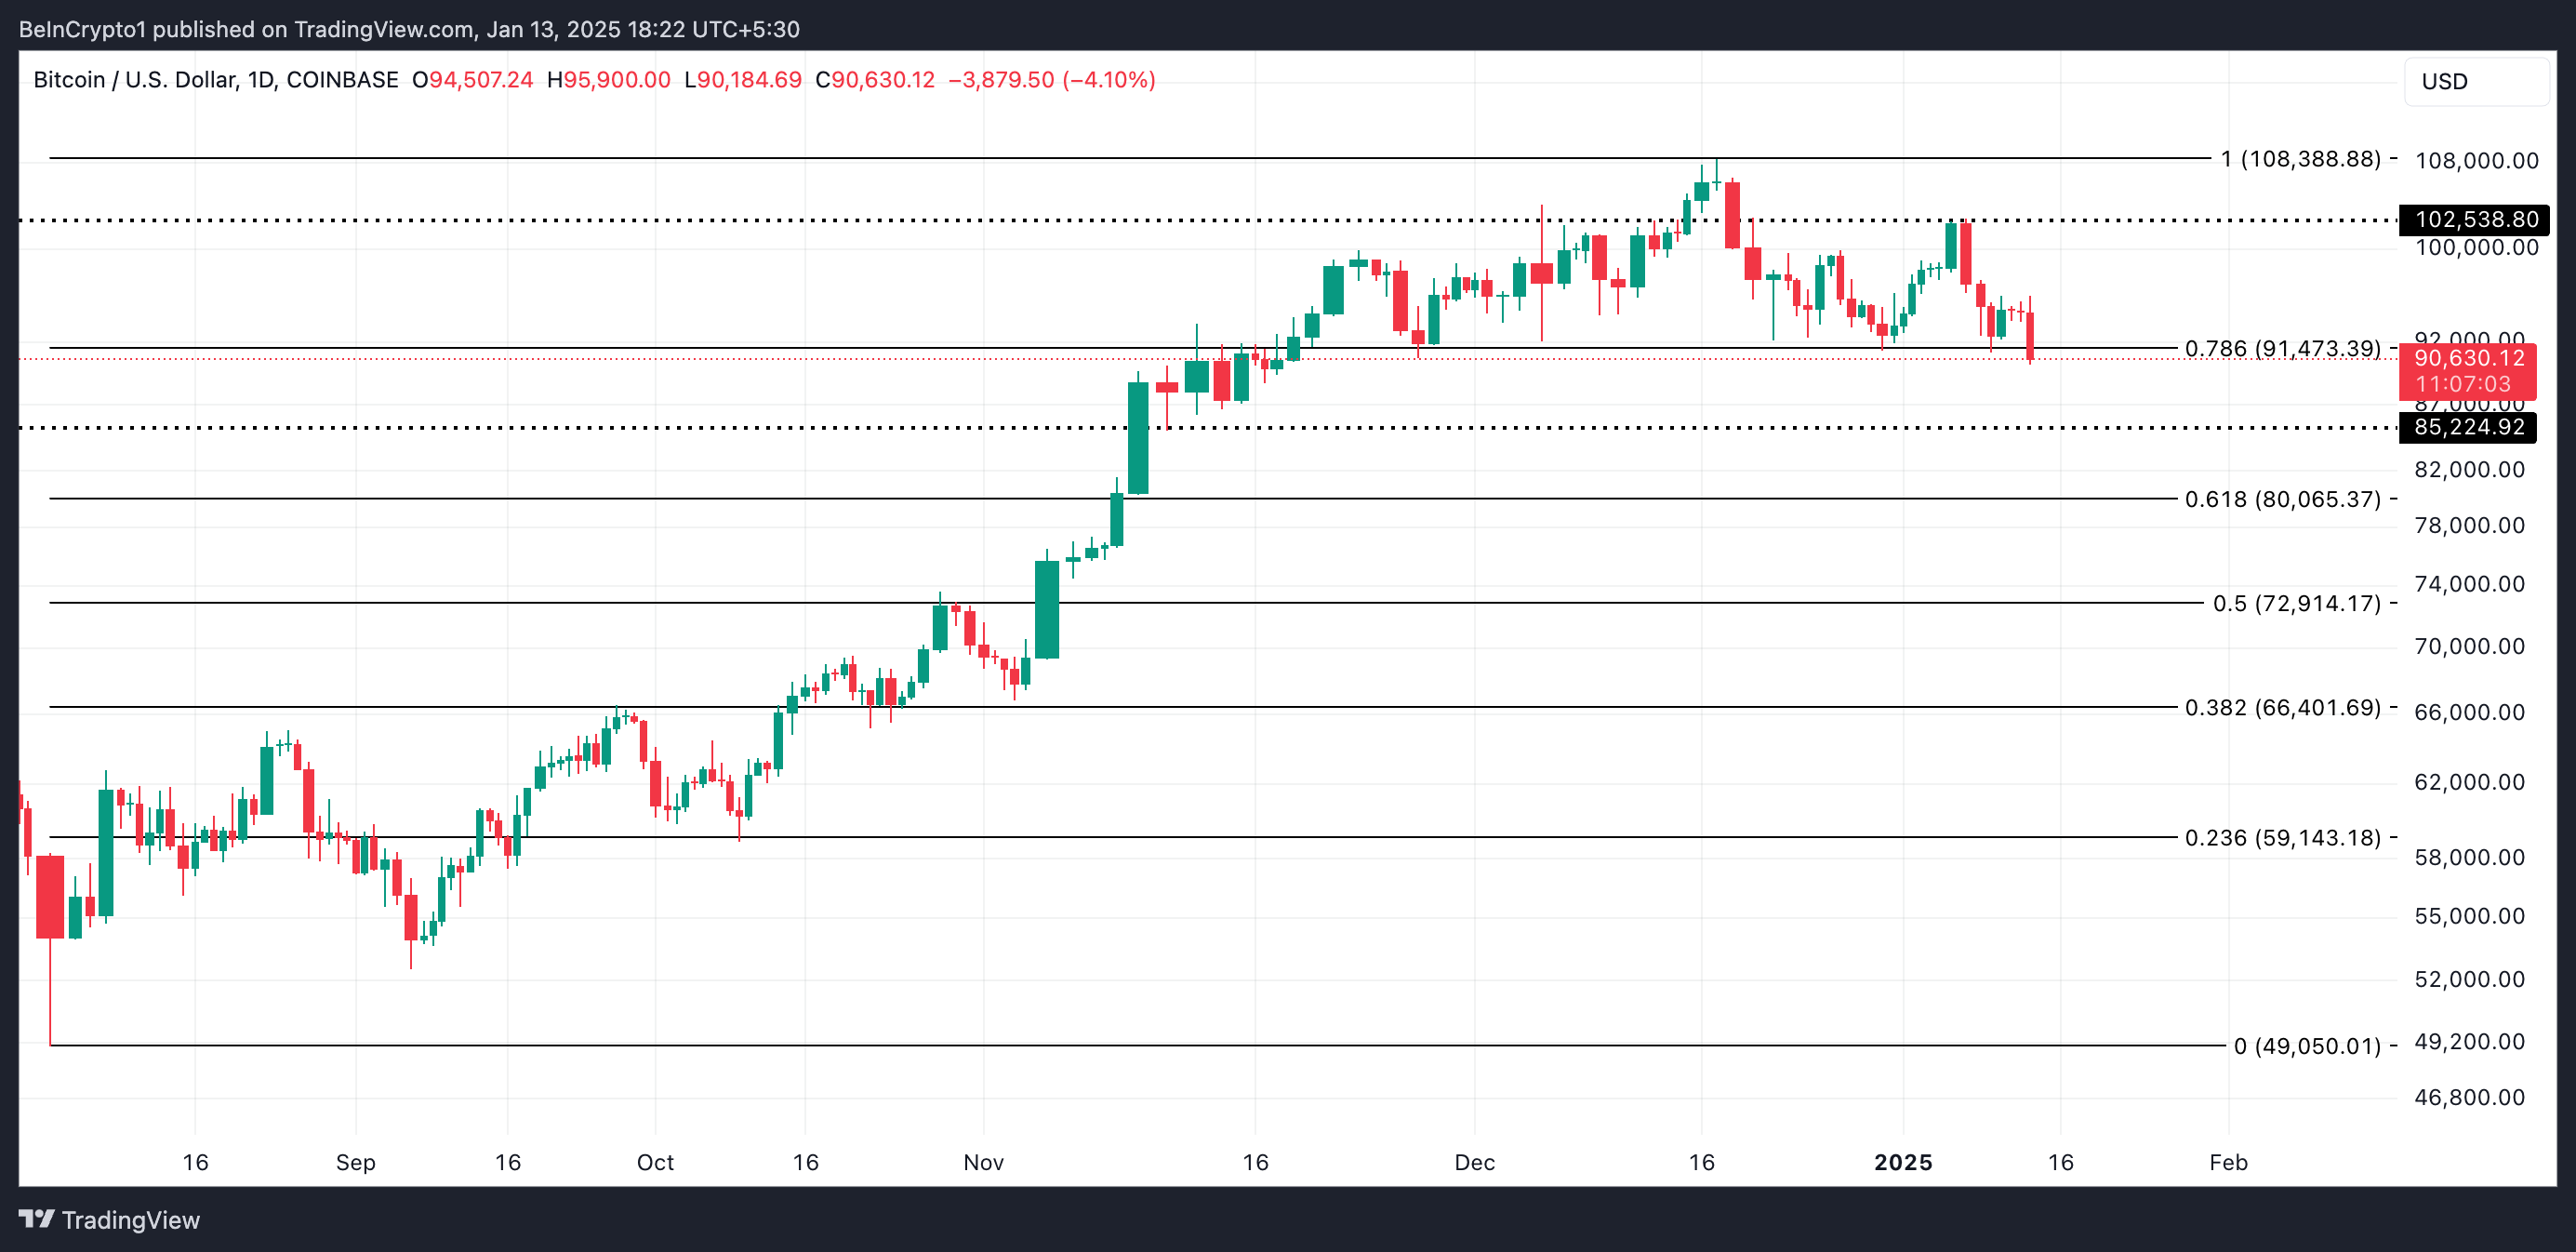
On the other hand, a shift in market trends could propel BTC’s price to $102,538.
免責聲明:投資有風險,本文並非投資建議,以上內容不應被視為任何金融產品的購買或出售要約、建議或邀請,作者或其他用戶的任何相關討論、評論或帖子也不應被視為此類內容。本文僅供一般參考,不考慮您的個人投資目標、財務狀況或需求。TTM對信息的準確性和完整性不承擔任何責任或保證,投資者應自行研究並在投資前尋求專業建議。
熱議股票
- 1
- 2
- 3
- 4
- 5
- 6
- 7
- 8
- 9
- 10