$100 Million Funding News Fail to Keep MOVE Price Afloat
- MOVE price has dropped 26% over the past week, with RSI and Ichimoku Cloud indicators signaling a strongly bearish trend.
- The RSI remains near oversold territory at 33.3, suggesting selling pressure may ease, but recovery momentum is still weak.
- A break below $0.70 could push MOVE toward $0.59, while a rebound above $0.83 may pave the way for a rally to $1.15.
Movement (MOVE) has dropped approximately 11% in the past 24 hours, extending its correction to 26% over the last seven days. Technical indicators, including the RSI and Ichimoku Cloud, point to a strongly bearish outlook, with MOVE trading near oversold levels and far below the cloud.
The recent formation of a death cross has intensified the downtrend, signaling increased selling pressure. For MOVE to recover, it must break through key resistance levels. However, failing to hold its current support could result in further declines.
Movement RSI Is Still Close to the Oversold Zone
MOVE RSI is currently at 33.3, recovering slightly after dropping to 29.7 a few hours ago. This represents a sharp decline from its RSI of 53 just two days ago, highlighting the asset’s rapid shift from neutral territory into oversold conditions.
The RSI (Relative Strength Index) is a momentum oscillator ranging from 0 to 100, used to assess whether an asset is overbought or oversold. Typically, values below 30 indicate oversold conditions, signaling that the asset may be undervalued, while values above 70 suggest overbought conditions, indicating potential price corrections.
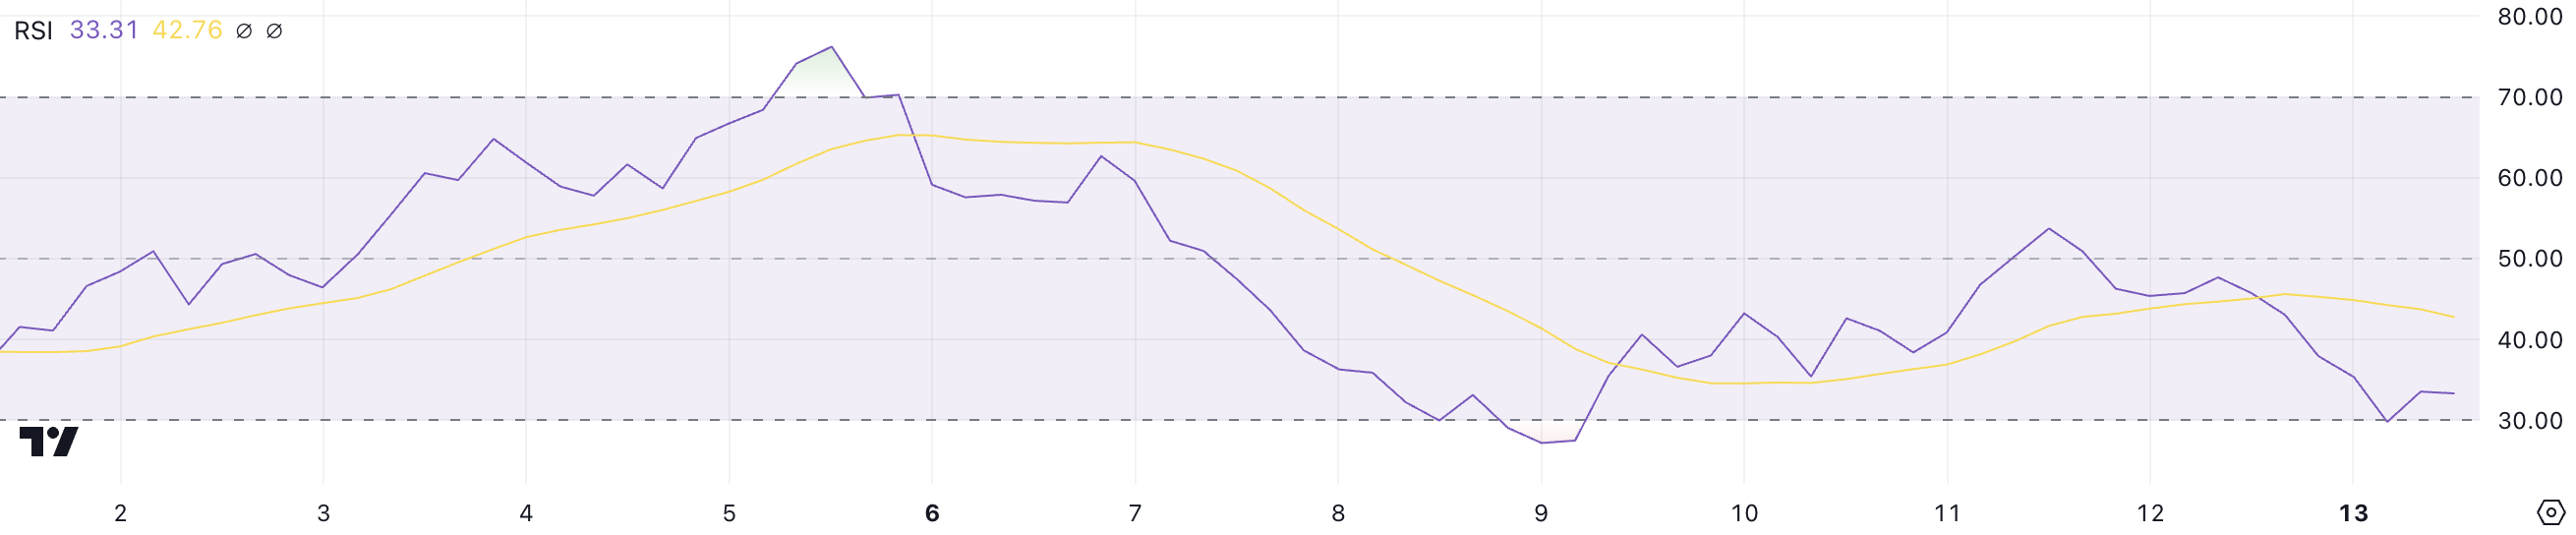
With MOVE’s RSI at 33.3, it remains near oversold territory, which could attract buyers seeking discounted entry points. This level suggests that the recent selling pressure may be easing slightly, offering a potential for price stabilization or recovery.
However, if the RSI fails to climb back toward neutral levels, it could indicate persistent bearish momentum, keeping MOVE’s price under pressure in the short term, even after Movement Labs, the company behind MOVE, raised $100 million in funding.
MOVE Ichimoku Cloud Paints a Bearish Picture
The Ichimoku Cloud chart for MOVE shows a strongly bearish configuration, with the price positioned well below the cloud (Kumo).
The cloud is red and widening, signaling increasing bearish momentum and a continuation of downward pressure. This suggests that the prevailing trend is firmly bearish, with no signs of weakening in the near term. This recent correction caused MOVE to lose its position among the top 50 altcoins, now sitting at 59.
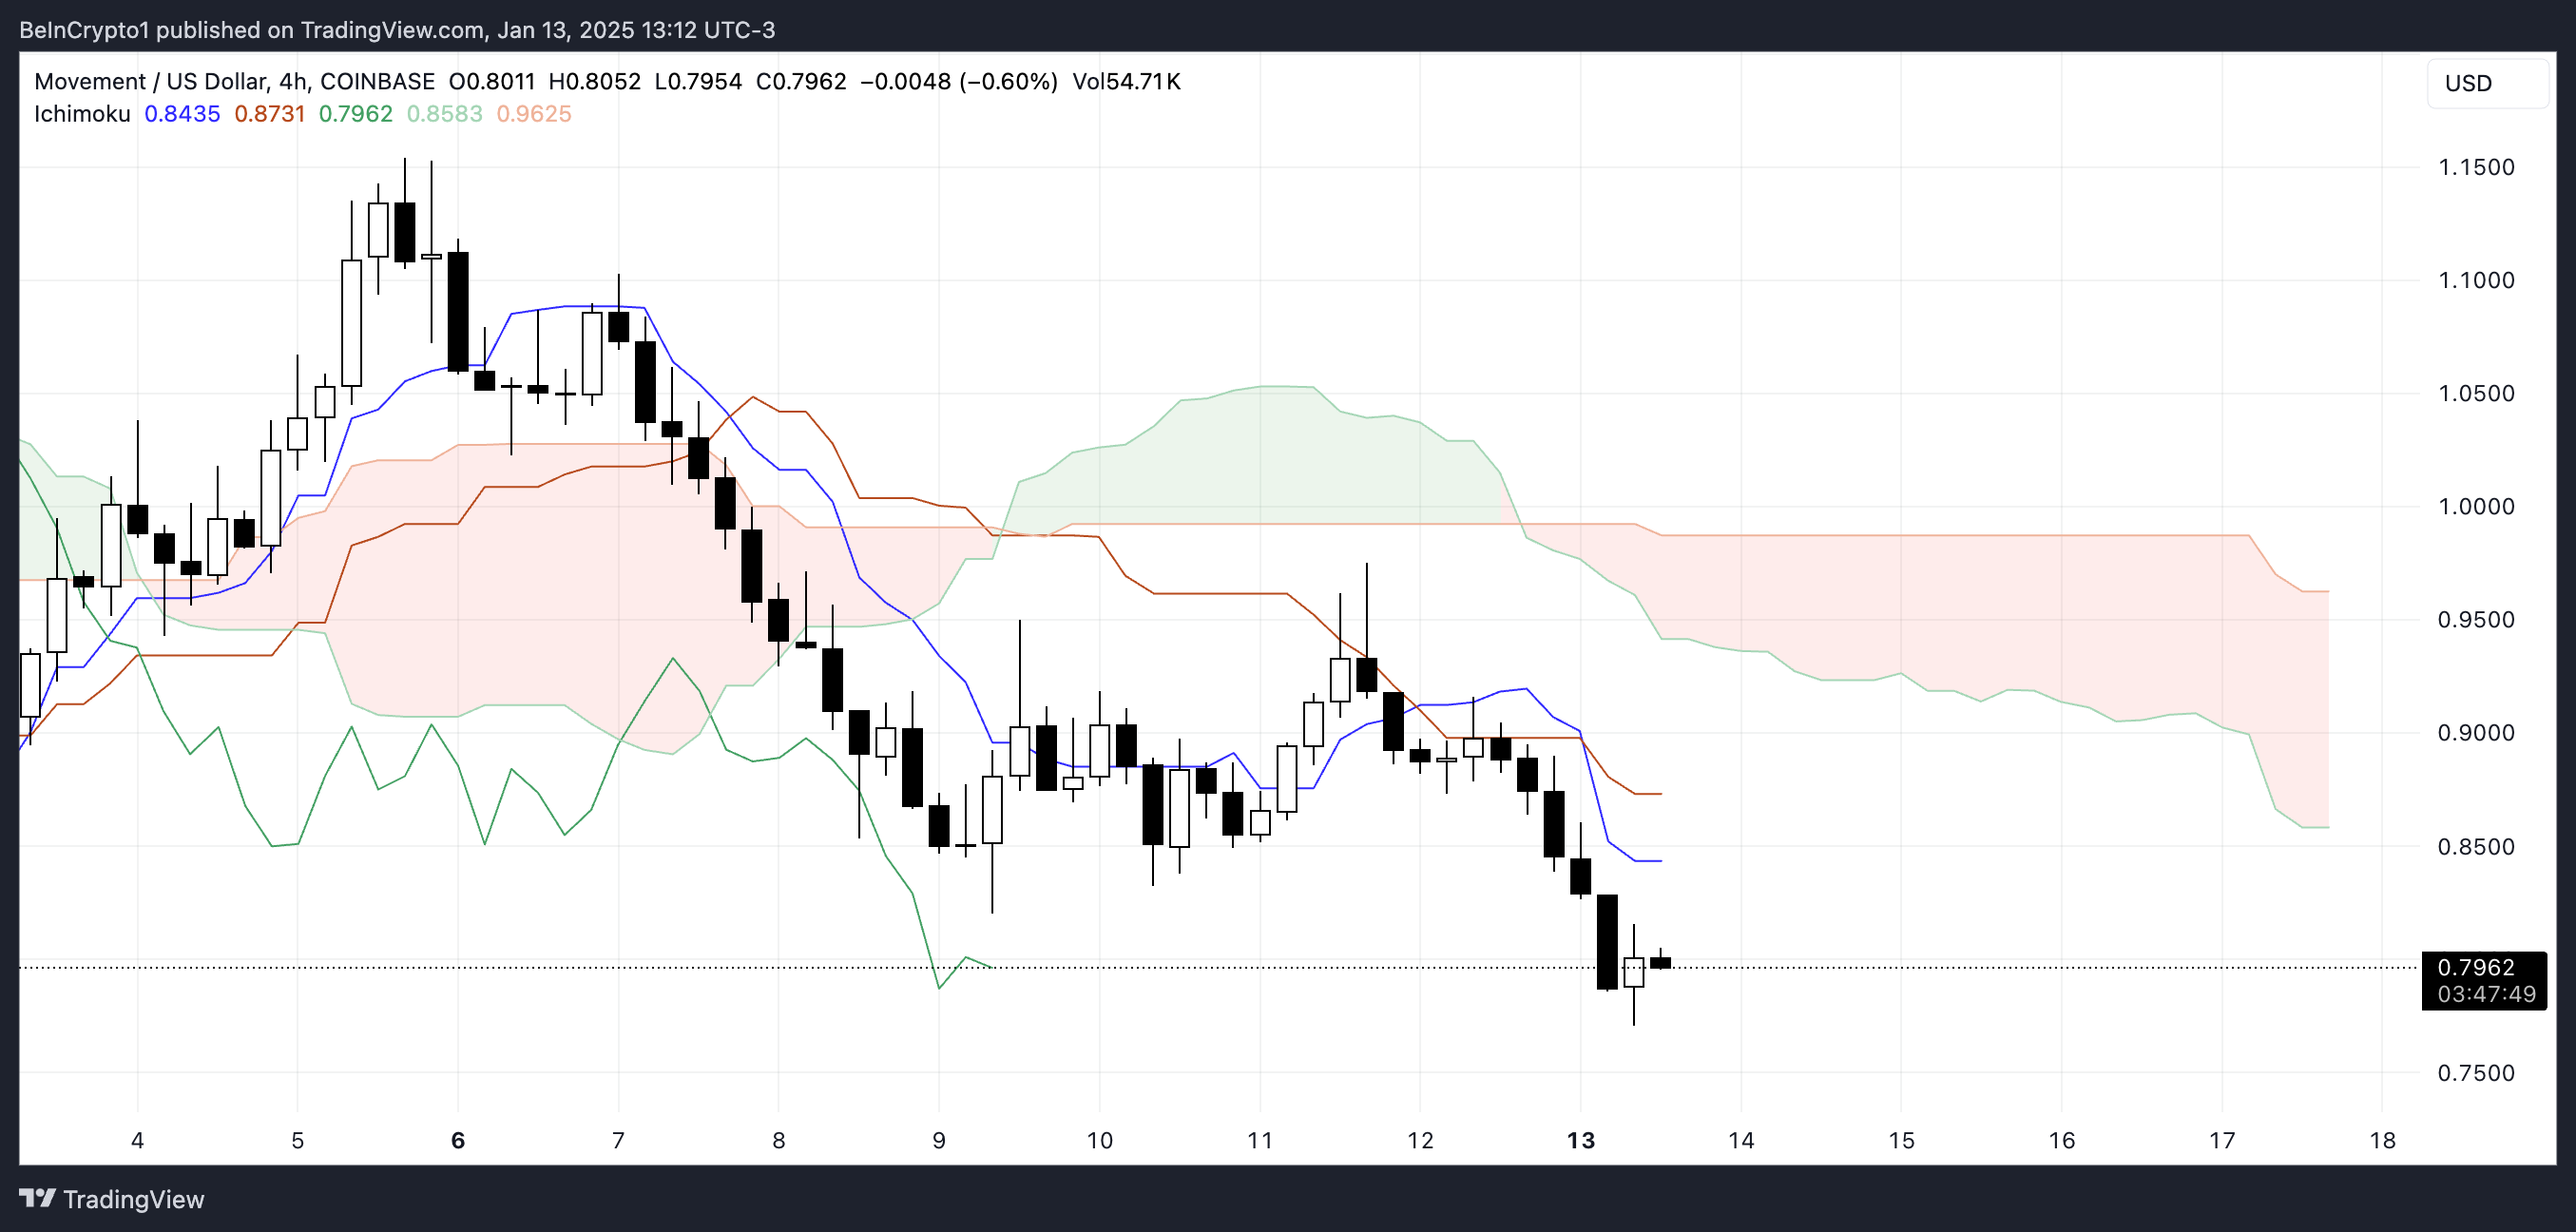
The conversion line (blue) remains below the baseline (red), confirming short-term bearish momentum. Additionally, the lagging span (green) is below both the price and the cloud, reinforcing the bearish outlook.
These alignments across the Ichimoku indicators suggest a persistent downtrend, with no immediate indications of a trend reversal. The cloud’s overall structure and lines reflect a market environment dominated by sellers.
MOVE Price Prediction: Will MOVE Recover $1 Levels Soon?
MOVE price recently formed a death cross, a bearish signal where its shortest-term moving average crossed below its longest-term one, indicating increased downward momentum. This technical alignment reinforces the ongoing bearish trend and suggests that selling pressure remains dominant.
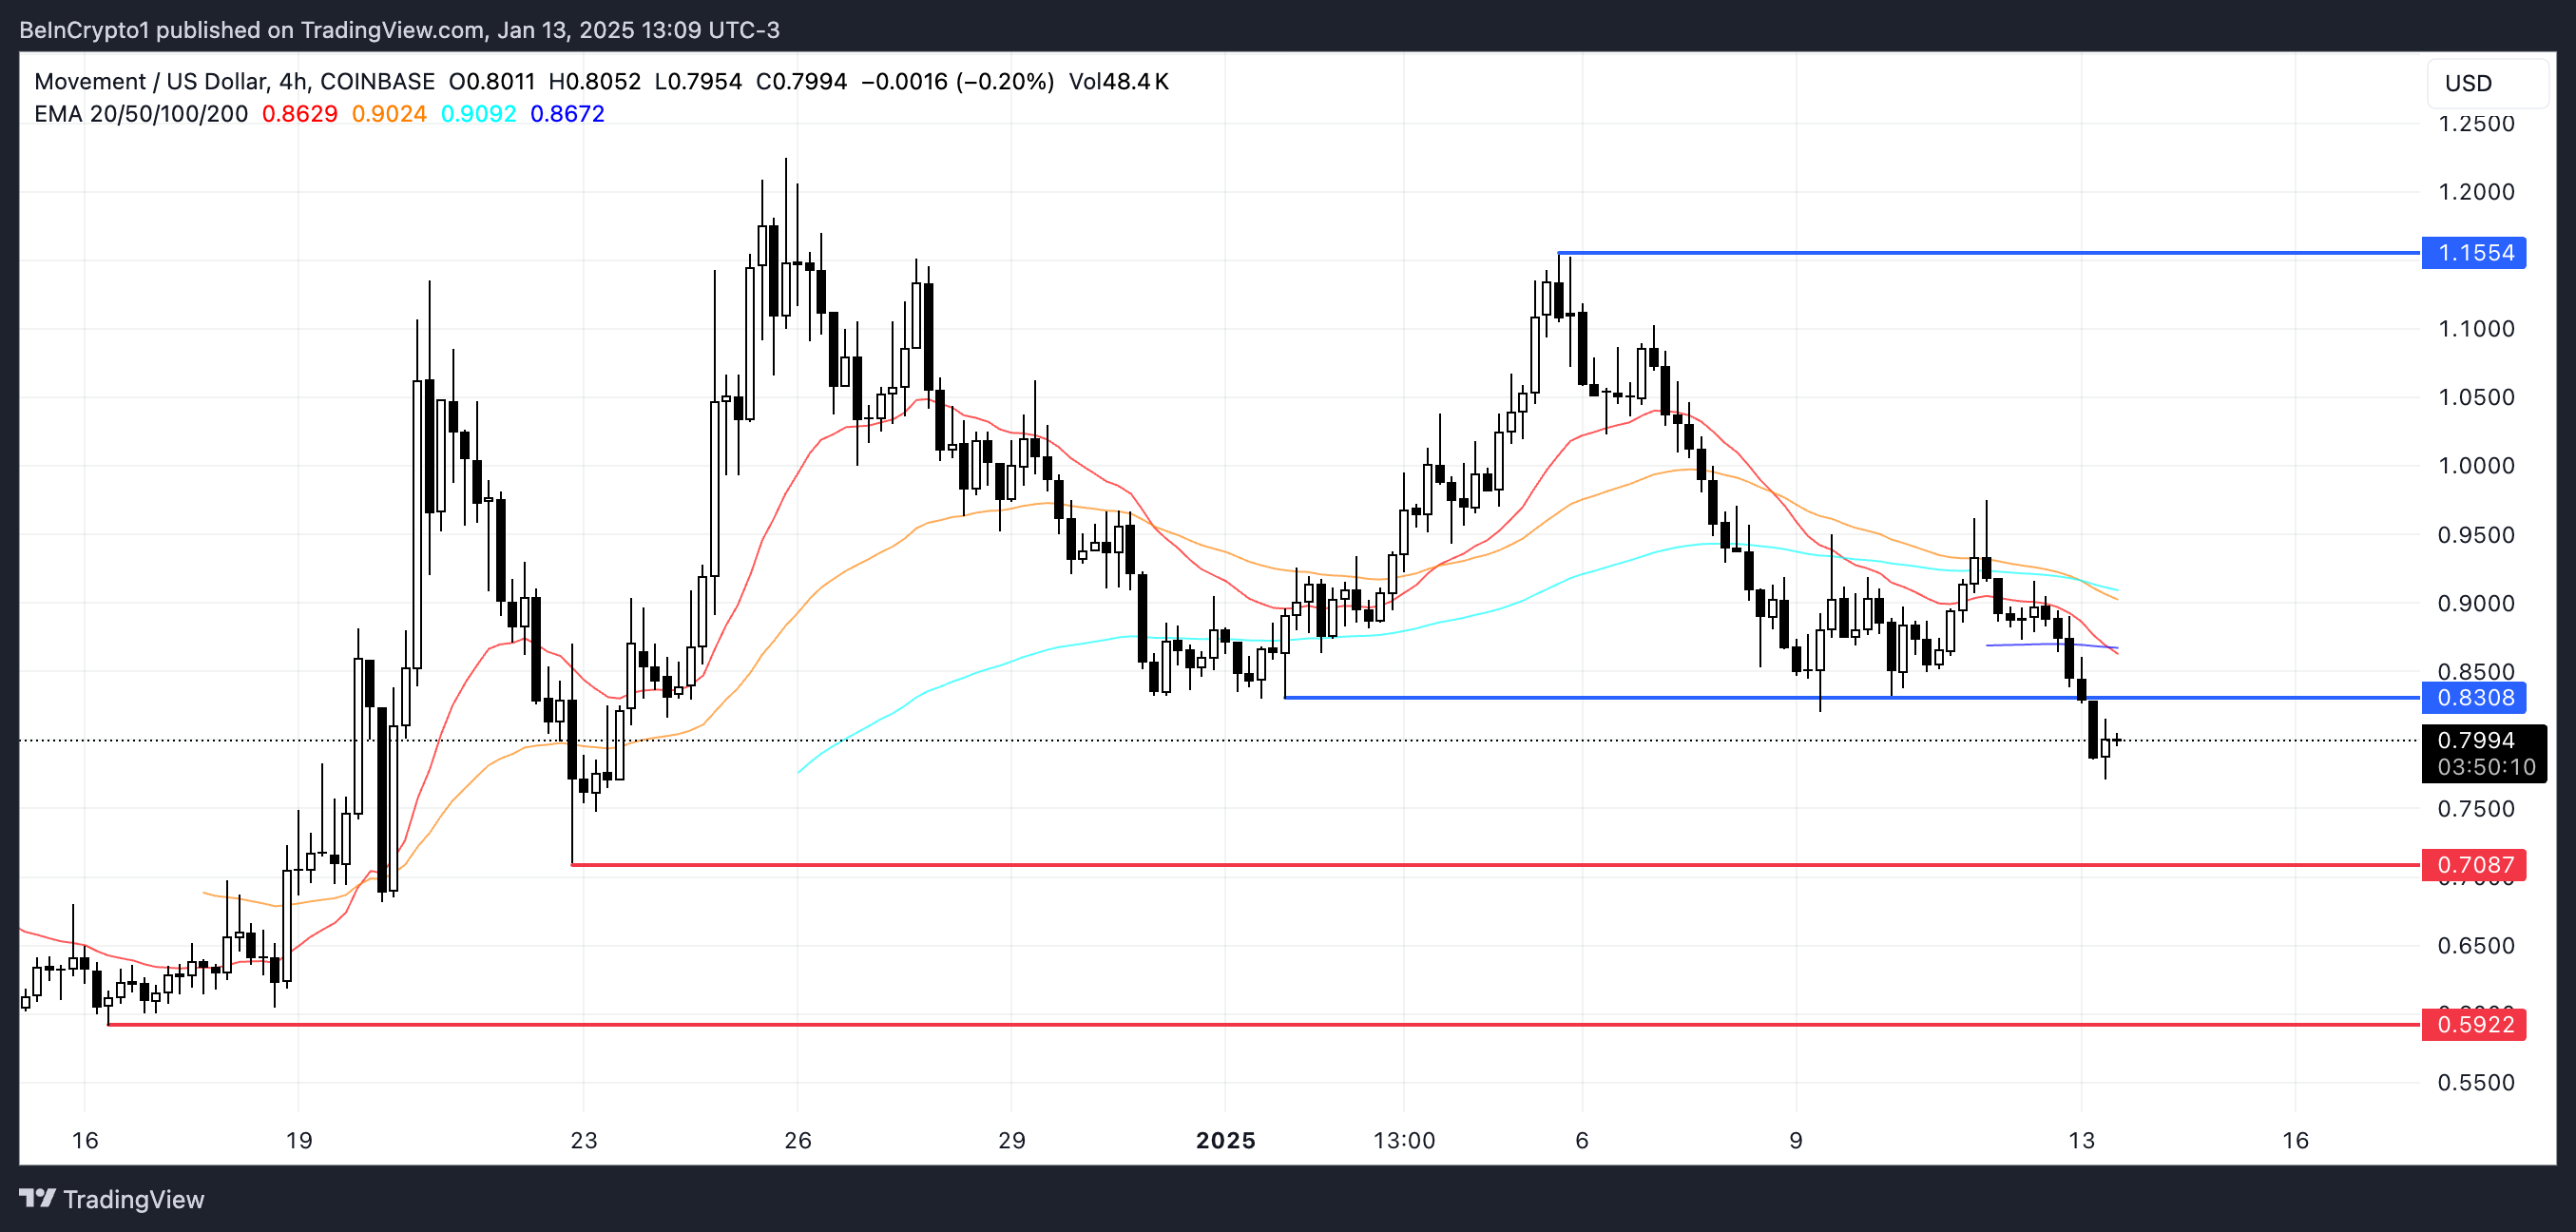
If the current downtrend persists and the support at $0.70 fails, the price could decline further toward $0.59. Conversely, if an uptrend emerges, MOVE could break the resistance at $0.83 and potentially rally to $1.15, marking a 43% upside, which could make Movemnet take back a place among the top 50 altcoins.
免責聲明:投資有風險,本文並非投資建議,以上內容不應被視為任何金融產品的購買或出售要約、建議或邀請,作者或其他用戶的任何相關討論、評論或帖子也不應被視為此類內容。本文僅供一般參考,不考慮您的個人投資目標、財務狀況或需求。TTM對信息的準確性和完整性不承擔任何責任或保證,投資者應自行研究並在投資前尋求專業建議。
熱議股票
- 1
- 2
- 3
- 4
- 5
- 6
- 7
- 8
- 9
- 10