Q P Group Holdings (HKG:1412) stock performs better than its underlying earnings growth over last five years
Stock pickers are generally looking for stocks that will outperform the broader market. Buying under-rated businesses is one path to excess returns. To wit, the Q P Group Holdings share price has climbed 37% in five years, easily topping the market decline of 11% (ignoring dividends). However, more recent returns haven't been as impressive as that, with the stock returning just 9.8% in the last year, including dividends.
On the back of a solid 7-day performance, let's check what role the company's fundamentals have played in driving long term shareholder returns.
See our latest analysis for Q P Group Holdings
In his essay The Superinvestors of Graham-and-Doddsville Warren Buffett described how share prices do not always rationally reflect the value of a business. One flawed but reasonable way to assess how sentiment around a company has changed is to compare the earnings per share (EPS) with the share price.
Over half a decade, Q P Group Holdings managed to grow its earnings per share at 0.3% a year. This EPS growth is slower than the share price growth of 7% per year, over the same period. So it's fair to assume the market has a higher opinion of the business than it did five years ago. That's not necessarily surprising considering the five-year track record of earnings growth.
You can see how EPS has changed over time in the image below (click on the chart to see the exact values).
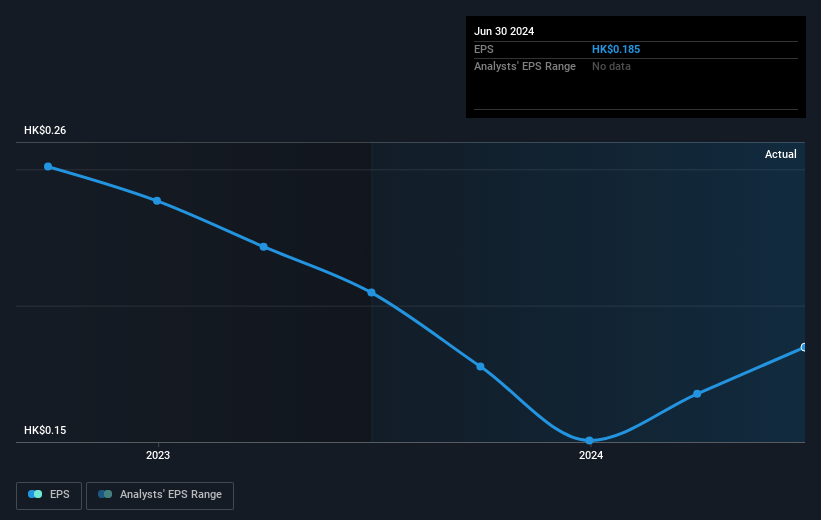
Dive deeper into Q P Group Holdings' key metrics by checking this interactive graph of Q P Group Holdings's earnings, revenue and cash flow.
What About Dividends?
As well as measuring the share price return, investors should also consider the total shareholder return (TSR). The TSR is a return calculation that accounts for the value of cash dividends (assuming that any dividend received was reinvested) and the calculated value of any discounted capital raisings and spin-offs. So for companies that pay a generous dividend, the TSR is often a lot higher than the share price return. We note that for Q P Group Holdings the TSR over the last 5 years was 134%, which is better than the share price return mentioned above. This is largely a result of its dividend payments!
A Different Perspective
Q P Group Holdings provided a TSR of 9.8% over the last twelve months. But that return falls short of the market. On the bright side, the longer term returns (running at about 19% a year, over half a decade) look better. It's quite possible the business continues to execute with prowess, even as the share price gains are slowing. It's always interesting to track share price performance over the longer term. But to understand Q P Group Holdings better, we need to consider many other factors. To that end, you should be aware of the 2 warning signs we've spotted with Q P Group Holdings .
Of course, you might find a fantastic investment by looking elsewhere. So take a peek at this free list of companies we expect will grow earnings.
Please note, the market returns quoted in this article reflect the market weighted average returns of stocks that currently trade on Hong Kong exchanges.
Valuation is complex, but we're here to simplify it.
Discover if Q P Group Holdings might be undervalued or overvalued with our detailed analysis, featuring fair value estimates, potential risks, dividends, insider trades, and its financial condition.
Access Free AnalysisHave feedback on this article? Concerned about the content? Get in touch with us directly. Alternatively, email editorial-team (at) simplywallst.com.This article by Simply Wall St is general in nature. We provide commentary based on historical data and analyst forecasts only using an unbiased methodology and our articles are not intended to be financial advice. It does not constitute a recommendation to buy or sell any stock, and does not take account of your objectives, or your financial situation. We aim to bring you long-term focused analysis driven by fundamental data. Note that our analysis may not factor in the latest price-sensitive company announcements or qualitative material. Simply Wall St has no position in any stocks mentioned.
免責聲明:投資有風險,本文並非投資建議,以上內容不應被視為任何金融產品的購買或出售要約、建議或邀請,作者或其他用戶的任何相關討論、評論或帖子也不應被視為此類內容。本文僅供一般參考,不考慮您的個人投資目標、財務狀況或需求。TTM對信息的準確性和完整性不承擔任何責任或保證,投資者應自行研究並在投資前尋求專業建議。
熱議股票
- 1
- 2
- 3
- 4
- 5
- 6
- 7
- 8
- 9
- 10