Could Fisher & Paykel Healthcare Corporation Limited's (NZSE:FPH) Weak Financials Mean That The Market Could Correct Its Share Price?
Fisher & Paykel Healthcare's (NZSE:FPH) stock is up by 3.2% over the past three months. However, in this article, we decided to focus on its weak financials, as long-term fundamentals ultimately dictate market outcomes. In this article, we decided to focus on Fisher & Paykel Healthcare's ROE.
Return on equity or ROE is a key measure used to assess how efficiently a company's management is utilizing the company's capital. In short, ROE shows the profit each dollar generates with respect to its shareholder investments.
Check out our latest analysis for Fisher & Paykel Healthcare
How To Calculate Return On Equity?
The formula for return on equity is:
Return on Equity = Net Profit (from continuing operations) ÷ Shareholders' Equity
So, based on the above formula, the ROE for Fisher & Paykel Healthcare is:
9.2% = NZ$179m ÷ NZ$1.9b (Based on the trailing twelve months to September 2024).
The 'return' refers to a company's earnings over the last year. That means that for every NZ$1 worth of shareholders' equity, the company generated NZ$0.09 in profit.
What Has ROE Got To Do With Earnings Growth?
We have already established that ROE serves as an efficient profit-generating gauge for a company's future earnings. Based on how much of its profits the company chooses to reinvest or "retain", we are then able to evaluate a company's future ability to generate profits. Generally speaking, other things being equal, firms with a high return on equity and profit retention, have a higher growth rate than firms that don’t share these attributes.
Fisher & Paykel Healthcare's Earnings Growth And 9.2% ROE
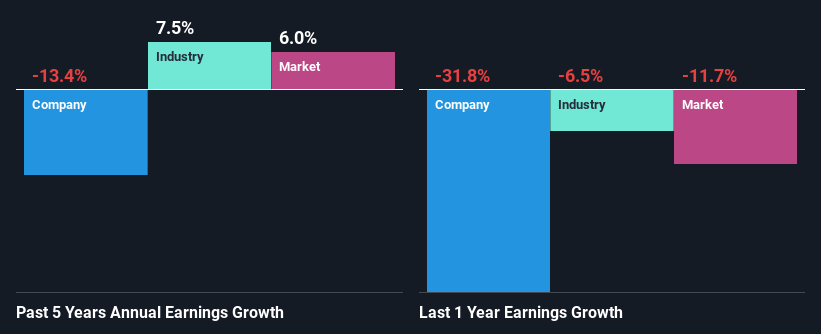
At first glance, Fisher & Paykel Healthcare's ROE doesn't look very promising. However, its ROE is similar to the industry average of 8.3%, so we won't completely dismiss the company. Having said that, Fisher & Paykel Healthcare's five year net income decline rate was 13%. Bear in mind, the company does have a slightly low ROE. So that's what might be causing earnings growth to shrink.
That being said, we compared Fisher & Paykel Healthcare's performance with the industry and were concerned when we found that while the company has shrunk its earnings, the industry has grown its earnings at a rate of 7.5% in the same 5-year period.
Earnings growth is an important metric to consider when valuing a stock. The investor should try to establish if the expected growth or decline in earnings, whichever the case may be, is priced in. This then helps them determine if the stock is placed for a bright or bleak future. One good indicator of expected earnings growth is the P/E ratio which determines the price the market is willing to pay for a stock based on its earnings prospects. So, you may want to check if Fisher & Paykel Healthcare is trading on a high P/E or a low P/E, relative to its industry.
Is Fisher & Paykel Healthcare Making Efficient Use Of Its Profits?
With a high three-year median payout ratio of 92% (implying that 7.8% of the profits are retained), most of Fisher & Paykel Healthcare's profits are being paid to shareholders, which explains the company's shrinking earnings. With only very little left to reinvest into the business, growth in earnings is far from likely. You can see the 2 risks we have identified for Fisher & Paykel Healthcare by visiting our risks dashboard for free on our platform here.
Additionally, Fisher & Paykel Healthcare has paid dividends over a period of at least ten years, which means that the company's management is determined to pay dividends even if it means little to no earnings growth. Our latest analyst data shows that the future payout ratio of the company is expected to drop to 65% over the next three years. The fact that the company's ROE is expected to rise to 24% over the same period is explained by the drop in the payout ratio.
Conclusion
In total, we would have a hard think before deciding on any investment action concerning Fisher & Paykel Healthcare. The low ROE, combined with the fact that the company is paying out almost if not all, of its profits as dividends, has resulted in the lack or absence of growth in its earnings. With that said, we studied the latest analyst forecasts and found that while the company has shrunk its earnings in the past, analysts expect its earnings to grow in the future. To know more about the latest analysts predictions for the company, check out this visualization of analyst forecasts for the company.
New: AI Stock Screener & Alerts
Our new AI Stock Screener scans the market every day to uncover opportunities.
• Dividend Powerhouses (3%+ Yield)• Undervalued Small Caps with Insider Buying• High growth Tech and AI CompaniesOr build your own from over 50 metrics.
Explore Now for FreeHave feedback on this article? Concerned about the content? Get in touch with us directly. Alternatively, email editorial-team (at) simplywallst.com.This article by Simply Wall St is general in nature. We provide commentary based on historical data and analyst forecasts only using an unbiased methodology and our articles are not intended to be financial advice. It does not constitute a recommendation to buy or sell any stock, and does not take account of your objectives, or your financial situation. We aim to bring you long-term focused analysis driven by fundamental data. Note that our analysis may not factor in the latest price-sensitive company announcements or qualitative material. Simply Wall St has no position in any stocks mentioned.
免責聲明:投資有風險,本文並非投資建議,以上內容不應被視為任何金融產品的購買或出售要約、建議或邀請,作者或其他用戶的任何相關討論、評論或帖子也不應被視為此類內容。本文僅供一般參考,不考慮您的個人投資目標、財務狀況或需求。TTM對信息的準確性和完整性不承擔任何責任或保證,投資者應自行研究並在投資前尋求專業建議。
熱議股票
- 1
- 2
- 3
- 4
- 5
- 6
- 7
- 8
- 9
- 10