Individual investors invested in Premier Investments Limited (ASX:PMV) copped the brunt of last week's AU$180m market cap decline
Key Insights
- The considerable ownership by individual investors in Premier Investments indicates that they collectively have a greater say in management and business strategy
- The top 4 shareholders own 53% of the company
- 11% of Premier Investments is held by insiders
Every investor in Premier Investments Limited (ASX:PMV) should be aware of the most powerful shareholder groups. With 32% stake, individual investors possess the maximum shares in the company. Put another way, the group faces the maximum upside potential (or downside risk).
And following last week's 4.0% decline in share price, individual investors suffered the most losses.
Let's take a closer look to see what the different types of shareholders can tell us about Premier Investments.
Check out our latest analysis for Premier Investments
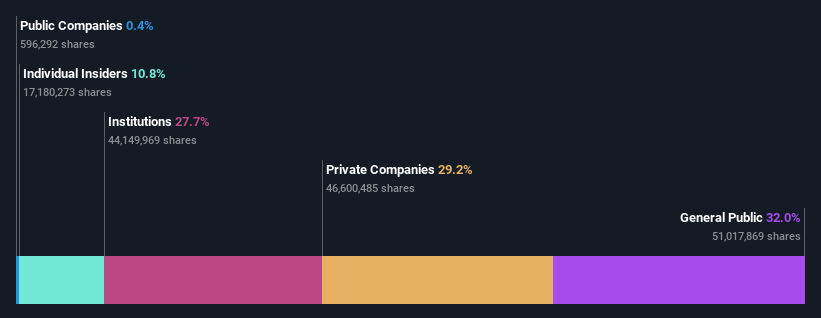
What Does The Institutional Ownership Tell Us About Premier Investments?
Institutions typically measure themselves against a benchmark when reporting to their own investors, so they often become more enthusiastic about a stock once it's included in a major index. We would expect most companies to have some institutions on the register, especially if they are growing.
We can see that Premier Investments does have institutional investors; and they hold a good portion of the company's stock. This suggests some credibility amongst professional investors. But we can't rely on that fact alone since institutions make bad investments sometimes, just like everyone does. If multiple institutions change their view on a stock at the same time, you could see the share price drop fast. It's therefore worth looking at Premier Investments' earnings history below. Of course, the future is what really matters.
Hedge funds don't have many shares in Premier Investments. Century Plaza Investments Pty. Ltd. is currently the largest shareholder, with 29% of shares outstanding. In comparison, the second and third largest shareholders hold about 10.0% and 8.3% of the stock.
To make our study more interesting, we found that the top 4 shareholders control more than half of the company which implies that this group has considerable sway over the company's decision-making.
While studying institutional ownership for a company can add value to your research, it is also a good practice to research analyst recommendations to get a deeper understand of a stock's expected performance. There are plenty of analysts covering the stock, so it might be worth seeing what they are forecasting, too.
Insider Ownership Of Premier Investments
While the precise definition of an insider can be subjective, almost everyone considers board members to be insiders. Company management run the business, but the CEO will answer to the board, even if he or she is a member of it.
Most consider insider ownership a positive because it can indicate the board is well aligned with other shareholders. However, on some occasions too much power is concentrated within this group.
Our information suggests that insiders maintain a significant holding in Premier Investments Limited. It is very interesting to see that insiders have a meaningful AU$461m stake in this AU$4.3b business. Most would say this shows a good degree of alignment with shareholders, especially in a company of this size. You can click here to see if those insiders have been buying or selling.
General Public Ownership
With a 32% ownership, the general public, mostly comprising of individual investors, have some degree of sway over Premier Investments. This size of ownership, while considerable, may not be enough to change company policy if the decision is not in sync with other large shareholders.
Private Company Ownership
We can see that Private Companies own 29%, of the shares on issue. Private companies may be related parties. Sometimes insiders have an interest in a public company through a holding in a private company, rather than in their own capacity as an individual. While it's hard to draw any broad stroke conclusions, it is worth noting as an area for further research.
Next Steps:
It's always worth thinking about the different groups who own shares in a company. But to understand Premier Investments better, we need to consider many other factors.
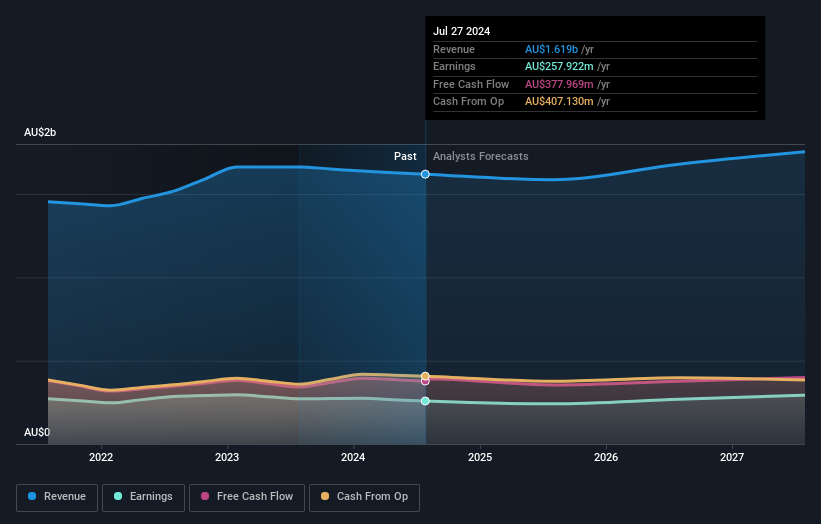
I like to dive deeper into how a company has performed in the past. You can access this interactive graph of past earnings, revenue and cash flow, for free.
If you are like me, you may want to think about whether this company will grow or shrink. Luckily, you can check this free report showing analyst forecasts for its future.
NB: Figures in this article are calculated using data from the last twelve months, which refer to the 12-month period ending on the last date of the month the financial statement is dated. This may not be consistent with full year annual report figures.
New: Manage All Your Stock Portfolios in One Place
We've created the ultimate portfolio companion for stock investors, and it's free.
• Connect an unlimited number of Portfolios and see your total in one currency• Be alerted to new Warning Signs or Risks via email or mobile• Track the Fair Value of your stocks
Try a Demo Portfolio for FreeHave feedback on this article? Concerned about the content? Get in touch with us directly. Alternatively, email editorial-team (at) simplywallst.com.This article by Simply Wall St is general in nature. We provide commentary based on historical data and analyst forecasts only using an unbiased methodology and our articles are not intended to be financial advice. It does not constitute a recommendation to buy or sell any stock, and does not take account of your objectives, or your financial situation. We aim to bring you long-term focused analysis driven by fundamental data. Note that our analysis may not factor in the latest price-sensitive company announcements or qualitative material. Simply Wall St has no position in any stocks mentioned.
免責聲明:投資有風險,本文並非投資建議,以上內容不應被視為任何金融產品的購買或出售要約、建議或邀請,作者或其他用戶的任何相關討論、評論或帖子也不應被視為此類內容。本文僅供一般參考,不考慮您的個人投資目標、財務狀況或需求。TTM對信息的準確性和完整性不承擔任何責任或保證,投資者應自行研究並在投資前尋求專業建議。
熱議股票
- 1
- 2
- 3
- 4
- 5
- 6
- 7
- 8
- 9
- 10