Sovereign wealth funds are Mercury NZ Limited's (NZSE:MCY) biggest owners and were rewarded after market cap rose by NZ$392m last week
Key Insights
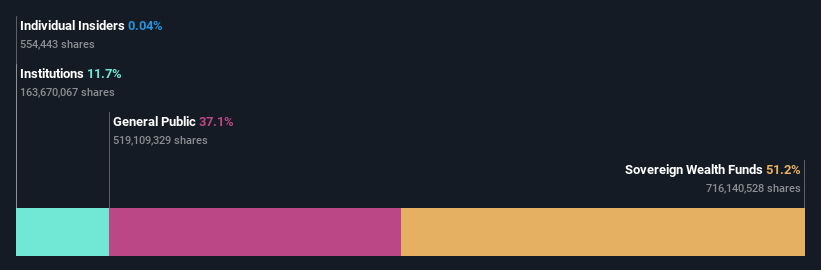
- The considerable ownership by sovereign wealth funds in Mercury NZ indicates that they collectively have a greater say in management and business strategy
- 51% of the company is held by a single shareholder (New Zealand Superannuation Fund)
- Institutions own 12% of Mercury NZ
Every investor in Mercury NZ Limited (NZSE:MCY) should be aware of the most powerful shareholder groups. With 51% stake, sovereign wealth funds possess the maximum shares in the company. In other words, the group stands to gain the most (or lose the most) from their investment into the company.
Clearly, sovereign wealth funds benefitted the most after the company's market cap rose by NZ$392m last week.
Let's delve deeper into each type of owner of Mercury NZ, beginning with the chart below.
Check out our latest analysis for Mercury NZ
What Does The Institutional Ownership Tell Us About Mercury NZ?
Institutional investors commonly compare their own returns to the returns of a commonly followed index. So they generally do consider buying larger companies that are included in the relevant benchmark index.
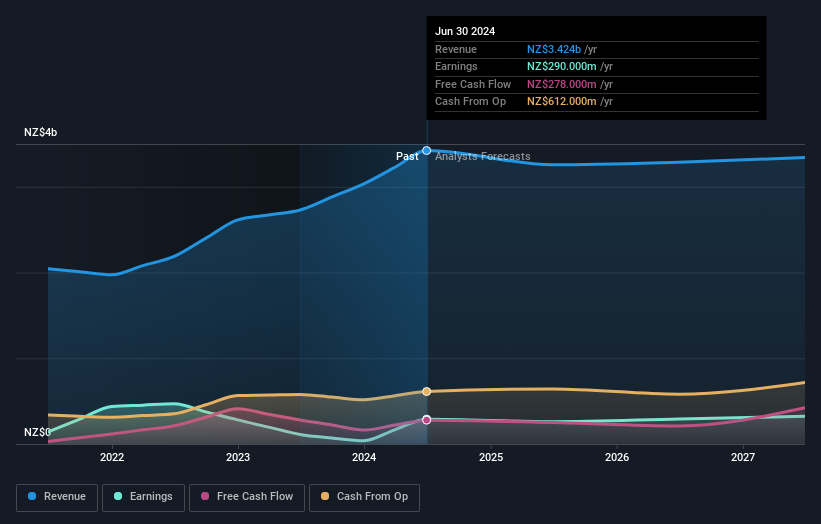
We can see that Mercury NZ does have institutional investors; and they hold a good portion of the company's stock. This can indicate that the company has a certain degree of credibility in the investment community. However, it is best to be wary of relying on the supposed validation that comes with institutional investors. They too, get it wrong sometimes. If multiple institutions change their view on a stock at the same time, you could see the share price drop fast. It's therefore worth looking at Mercury NZ's earnings history below. Of course, the future is what really matters.
We note that hedge funds don't have a meaningful investment in Mercury NZ. Looking at our data, we can see that the largest shareholder is New Zealand Superannuation Fund with 51% of shares outstanding. This implies that they have majority interest control of the future of the company. In comparison, the second and third largest shareholders hold about 2.0% and 1.5% of the stock.
Researching institutional ownership is a good way to gauge and filter a stock's expected performance. The same can be achieved by studying analyst sentiments. There are a reasonable number of analysts covering the stock, so it might be useful to find out their aggregate view on the future.
Insider Ownership Of Mercury NZ
The definition of company insiders can be subjective and does vary between jurisdictions. Our data reflects individual insiders, capturing board members at the very least. Company management run the business, but the CEO will answer to the board, even if he or she is a member of it.
Most consider insider ownership a positive because it can indicate the board is well aligned with other shareholders. However, on some occasions too much power is concentrated within this group.
Our data suggests that insiders own under 1% of Mercury NZ Limited in their own names. It is a pretty big company, so it would be possible for board members to own a meaningful interest in the company, without owning much of a proportional interest. In this case, they own around NZ$3.5m worth of shares (at current prices). It is always good to see at least some insider ownership, but it might be worth checking if those insiders have been selling.
General Public Ownership
The general public, who are usually individual investors, hold a 37% stake in Mercury NZ. While this size of ownership may not be enough to sway a policy decision in their favour, they can still make a collective impact on company policies.
Next Steps:
It's always worth thinking about the different groups who own shares in a company. But to understand Mercury NZ better, we need to consider many other factors. Take risks for example - Mercury NZ has 1 warning sign we think you should be aware of.
If you would prefer discover what analysts are predicting in terms of future growth, do not miss this free report on analyst forecasts.
NB: Figures in this article are calculated using data from the last twelve months, which refer to the 12-month period ending on the last date of the month the financial statement is dated. This may not be consistent with full year annual report figures.
New: Manage All Your Stock Portfolios in One Place
We've created the ultimate portfolio companion for stock investors, and it's free.
• Connect an unlimited number of Portfolios and see your total in one currency• Be alerted to new Warning Signs or Risks via email or mobile• Track the Fair Value of your stocks
Try a Demo Portfolio for FreeHave feedback on this article? Concerned about the content? Get in touch with us directly. Alternatively, email editorial-team (at) simplywallst.com.This article by Simply Wall St is general in nature. We provide commentary based on historical data and analyst forecasts only using an unbiased methodology and our articles are not intended to be financial advice. It does not constitute a recommendation to buy or sell any stock, and does not take account of your objectives, or your financial situation. We aim to bring you long-term focused analysis driven by fundamental data. Note that our analysis may not factor in the latest price-sensitive company announcements or qualitative material. Simply Wall St has no position in any stocks mentioned.
免責聲明:投資有風險,本文並非投資建議,以上內容不應被視為任何金融產品的購買或出售要約、建議或邀請,作者或其他用戶的任何相關討論、評論或帖子也不應被視為此類內容。本文僅供一般參考,不考慮您的個人投資目標、財務狀況或需求。TTM對信息的準確性和完整性不承擔任何責任或保證,投資者應自行研究並在投資前尋求專業建議。
熱議股票
- 1
- 2
- 3
- 4
- 5
- 6
- 7
- 8
- 9
- 10