Ensign Group (NASDAQ:ENSG) Might Have The Makings Of A Multi-Bagger
If we want to find a potential multi-bagger, often there are underlying trends that can provide clues. In a perfect world, we'd like to see a company investing more capital into its business and ideally the returns earned from that capital are also increasing. Ultimately, this demonstrates that it's a business that is reinvesting profits at increasing rates of return. So when we looked at Ensign Group (NASDAQ:ENSG) and its trend of ROCE, we really liked what we saw.
Understanding Return On Capital Employed (ROCE)
For those that aren't sure what ROCE is, it measures the amount of pre-tax profits a company can generate from the capital employed in its business. To calculate this metric for Ensign Group, this is the formula:
Return on Capital Employed = Earnings Before Interest and Tax (EBIT) ÷ (Total Assets - Current Liabilities)
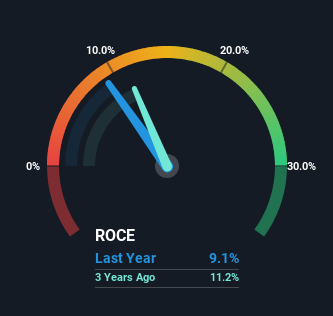
0.091 = US$358m ÷ (US$4.7b - US$743m) (Based on the trailing twelve months to December 2024).
Thus, Ensign Group has an ROCE of 9.1%. On its own, that's a low figure but it's around the 10% average generated by the Healthcare industry.
Check out our latest analysis for Ensign Group
In the above chart we have measured Ensign Group's prior ROCE against its prior performance, but the future is arguably more important. If you're interested, you can view the analysts predictions in our free analyst report for Ensign Group .
So How Is Ensign Group's ROCE Trending?
While in absolute terms it isn't a high ROCE, it's promising to see that it has been moving in the right direction. Over the last five years, returns on capital employed have risen substantially to 9.1%. The amount of capital employed has increased too, by 94%. So we're very much inspired by what we're seeing at Ensign Group thanks to its ability to profitably reinvest capital.
Our Take On Ensign Group's ROCE
To sum it up, Ensign Group has proven it can reinvest in the business and generate higher returns on that capital employed, which is terrific. And with the stock having performed exceptionally well over the last five years, these patterns are being accounted for by investors. Therefore, we think it would be worth your time to check if these trends are going to continue.
While Ensign Group looks impressive, no company is worth an infinite price. The intrinsic value infographic for ENSG helps visualize whether it is currently trading for a fair price.
While Ensign Group isn't earning the highest return, check out this free list of companies that are earning high returns on equity with solid balance sheets.
Valuation is complex, but we're here to simplify it.
Discover if Ensign Group might be undervalued or overvalued with our detailed analysis, featuring fair value estimates, potential risks, dividends, insider trades, and its financial condition.
Access Free AnalysisHave feedback on this article? Concerned about the content? Get in touch with us directly. Alternatively, email editorial-team (at) simplywallst.com.This article by Simply Wall St is general in nature. We provide commentary based on historical data and analyst forecasts only using an unbiased methodology and our articles are not intended to be financial advice. It does not constitute a recommendation to buy or sell any stock, and does not take account of your objectives, or your financial situation. We aim to bring you long-term focused analysis driven by fundamental data. Note that our analysis may not factor in the latest price-sensitive company announcements or qualitative material. Simply Wall St has no position in any stocks mentioned.
免責聲明:投資有風險,本文並非投資建議,以上內容不應被視為任何金融產品的購買或出售要約、建議或邀請,作者或其他用戶的任何相關討論、評論或帖子也不應被視為此類內容。本文僅供一般參考,不考慮您的個人投資目標、財務狀況或需求。TTM對信息的準確性和完整性不承擔任何責任或保證,投資者應自行研究並在投資前尋求專業建議。
熱議股票
- 1
- 2
- 3
- 4
- 5
- 6
- 7
- 8
- 9
- 10