It's Down 34% But Hua Yin International Holdings Limited (HKG:989) Could Be Riskier Than It Looks
The Hua Yin International Holdings Limited (HKG:989) share price has fared very poorly over the last month, falling by a substantial 34%. The recent drop completes a disastrous twelve months for shareholders, who are sitting on a 77% loss during that time.
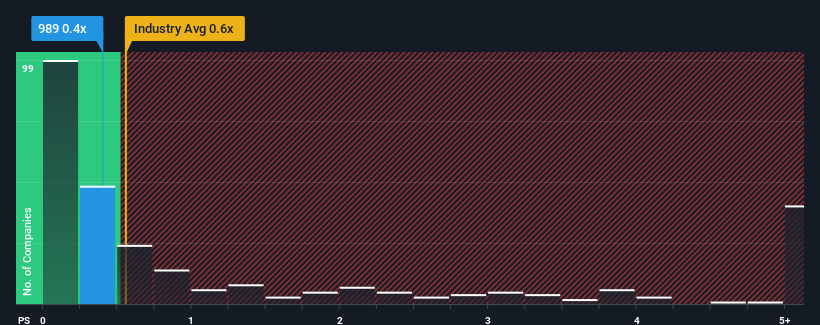
Although its price has dipped substantially, you could still be forgiven for feeling indifferent about Hua Yin International Holdings' P/S ratio of 0.4x, since the median price-to-sales (or "P/S") ratio for the Real Estate industry in Hong Kong is also close to 0.6x. However, investors might be overlooking a clear opportunity or potential setback if there is no rational basis for the P/S.
Check out our latest analysis for Hua Yin International Holdings
What Does Hua Yin International Holdings' P/S Mean For Shareholders?
With revenue growth that's exceedingly strong of late, Hua Yin International Holdings has been doing very well. The P/S is probably moderate because investors think this strong revenue growth might not be enough to outperform the broader industry in the near future. If that doesn't eventuate, then existing shareholders have reason to be feeling optimistic about the future direction of the share price.
Although there are no analyst estimates available for Hua Yin International Holdings, take a look at this free data-rich visualisation to see how the company stacks up on earnings, revenue and cash flow.Is There Some Revenue Growth Forecasted For Hua Yin International Holdings?
In order to justify its P/S ratio, Hua Yin International Holdings would need to produce growth that's similar to the industry.
If we review the last year of revenue growth, the company posted a terrific increase of 96%. The latest three year period has also seen an excellent 67% overall rise in revenue, aided by its short-term performance. Therefore, it's fair to say the revenue growth recently has been superb for the company.
Comparing that to the industry, which is only predicted to deliver 5.1% growth in the next 12 months, the company's momentum is stronger based on recent medium-term annualised revenue results.
With this information, we find it interesting that Hua Yin International Holdings is trading at a fairly similar P/S compared to the industry. Apparently some shareholders believe the recent performance is at its limits and have been accepting lower selling prices.
The Final Word
Hua Yin International Holdings' plummeting stock price has brought its P/S back to a similar region as the rest of the industry. Generally, our preference is to limit the use of the price-to-sales ratio to establishing what the market thinks about the overall health of a company.
We've established that Hua Yin International Holdings currently trades on a lower than expected P/S since its recent three-year growth is higher than the wider industry forecast. When we see strong revenue with faster-than-industry growth, we can only assume potential risks are what might be placing pressure on the P/S ratio. It appears some are indeed anticipating revenue instability, because the persistence of these recent medium-term conditions would normally provide a boost to the share price.
Before you settle on your opinion, we've discovered 3 warning signs for Hua Yin International Holdings (2 don't sit too well with us!) that you should be aware of.
If you're unsure about the strength of Hua Yin International Holdings' business, why not explore our interactive list of stocks with solid business fundamentals for some other companies you may have missed.
Valuation is complex, but we're here to simplify it.
Discover if Hua Yin International Holdings might be undervalued or overvalued with our detailed analysis, featuring fair value estimates, potential risks, dividends, insider trades, and its financial condition.
Access Free AnalysisHave feedback on this article? Concerned about the content? Get in touch with us directly. Alternatively, email editorial-team (at) simplywallst.com.This article by Simply Wall St is general in nature. We provide commentary based on historical data and analyst forecasts only using an unbiased methodology and our articles are not intended to be financial advice. It does not constitute a recommendation to buy or sell any stock, and does not take account of your objectives, or your financial situation. We aim to bring you long-term focused analysis driven by fundamental data. Note that our analysis may not factor in the latest price-sensitive company announcements or qualitative material. Simply Wall St has no position in any stocks mentioned.
免責聲明:投資有風險,本文並非投資建議,以上內容不應被視為任何金融產品的購買或出售要約、建議或邀請,作者或其他用戶的任何相關討論、評論或帖子也不應被視為此類內容。本文僅供一般參考,不考慮您的個人投資目標、財務狀況或需求。TTM對信息的準確性和完整性不承擔任何責任或保證,投資者應自行研究並在投資前尋求專業建議。
熱議股票
- 1
- 2
- 3
- 4
- 5
- 6
- 7
- 8
- 9
- 10