Some Investors May Be Worried About Huashi Group Holdings' (HKG:1111) Returns On Capital
If we want to find a stock that could multiply over the long term, what are the underlying trends we should look for? Amongst other things, we'll want to see two things; firstly, a growing return on capital employed (ROCE) and secondly, an expansion in the company's amount of capital employed. This shows us that it's a compounding machine, able to continually reinvest its earnings back into the business and generate higher returns. So when we looked at Huashi Group Holdings (HKG:1111), they do have a high ROCE, but we weren't exactly elated from how returns are trending.
We've found 21 US stocks that are forecast to pay a dividend yield of over 6% next year. See the full list for free.
What Is Return On Capital Employed (ROCE)?
For those who don't know, ROCE is a measure of a company's yearly pre-tax profit (its return), relative to the capital employed in the business. The formula for this calculation on Huashi Group Holdings is:
Return on Capital Employed = Earnings Before Interest and Tax (EBIT) ÷ (Total Assets - Current Liabilities)
0.30 = CN¥98m ÷ (CN¥578m - CN¥248m) (Based on the trailing twelve months to June 2024).
So, Huashi Group Holdings has an ROCE of 30%. That's a fantastic return and not only that, it outpaces the average of 8.8% earned by companies in a similar industry.
See our latest analysis for Huashi Group Holdings
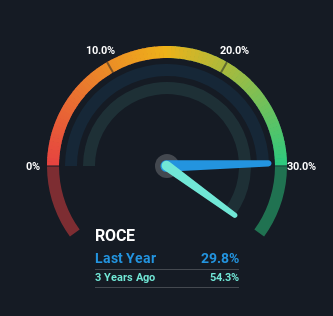
While the past is not representative of the future, it can be helpful to know how a company has performed historically, which is why we have this chart above. If you'd like to look at how Huashi Group Holdings has performed in the past in other metrics, you can view this free graph of Huashi Group Holdings' past earnings, revenue and cash flow.
What The Trend Of ROCE Can Tell Us
When we looked at the ROCE trend at Huashi Group Holdings, we didn't gain much confidence. To be more specific, while the ROCE is still high, it's fallen from 54% where it was three years ago. However, given capital employed and revenue have both increased it appears that the business is currently pursuing growth, at the consequence of short term returns. If these investments prove successful, this can bode very well for long term stock performance.
While on the subject, we noticed that the ratio of current liabilities to total assets has risen to 43%, which has impacted the ROCE. If current liabilities hadn't increased as much as they did, the ROCE could actually be even lower. What this means is that in reality, a rather large portion of the business is being funded by the likes of the company's suppliers or short-term creditors, which can bring some risks of its own.
The Key Takeaway
Even though returns on capital have fallen in the short term, we find it promising that revenue and capital employed have both increased for Huashi Group Holdings. And there could be an opportunity here if other metrics look good too, because the stock has declined 44% in the last year. So we think it'd be worthwhile to look further into this stock given the trends look encouraging.
One final note, you should learn about the 2 warning signs we've spotted with Huashi Group Holdings (including 1 which is a bit concerning) .
If you want to search for more stocks that have been earning high returns, check out this free list of stocks with solid balance sheets that are also earning high returns on equity.
Valuation is complex, but we're here to simplify it.
Discover if Huashi Group Holdings might be undervalued or overvalued with our detailed analysis, featuring fair value estimates, potential risks, dividends, insider trades, and its financial condition.
Access Free AnalysisHave feedback on this article? Concerned about the content? Get in touch with us directly. Alternatively, email editorial-team (at) simplywallst.com.This article by Simply Wall St is general in nature. We provide commentary based on historical data and analyst forecasts only using an unbiased methodology and our articles are not intended to be financial advice. It does not constitute a recommendation to buy or sell any stock, and does not take account of your objectives, or your financial situation. We aim to bring you long-term focused analysis driven by fundamental data. Note that our analysis may not factor in the latest price-sensitive company announcements or qualitative material. Simply Wall St has no position in any stocks mentioned.
免責聲明:投資有風險,本文並非投資建議,以上內容不應被視為任何金融產品的購買或出售要約、建議或邀請,作者或其他用戶的任何相關討論、評論或帖子也不應被視為此類內容。本文僅供一般參考,不考慮您的個人投資目標、財務狀況或需求。TTM對信息的準確性和完整性不承擔任何責任或保證,投資者應自行研究並在投資前尋求專業建議。
熱議股票
- 1
- 2
- 3
- 4
- 5
- 6
- 7
- 8
- 9
- 10