Investors Interested In SANVO Fine Chemicals Group Limited's (HKG:301) Revenues
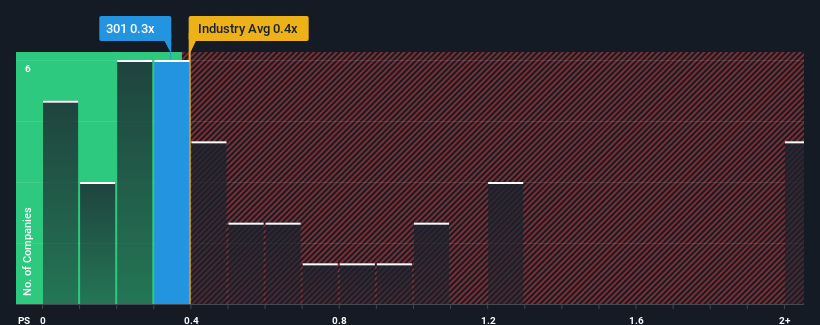
It's not a stretch to say that SANVO Fine Chemicals Group Limited's (HKG:301) price-to-sales (or "P/S") ratio of 0.3x right now seems quite "middle-of-the-road" for companies in the Chemicals industry in Hong Kong, where the median P/S ratio is around 0.4x. However, investors might be overlooking a clear opportunity or potential setback if there is no rational basis for the P/S.
This technology could replace computers: discover the 20 stocks are working to make quantum computing a reality.
View our latest analysis for SANVO Fine Chemicals Group
What Does SANVO Fine Chemicals Group's Recent Performance Look Like?
For instance, SANVO Fine Chemicals Group's receding revenue in recent times would have to be some food for thought. Perhaps investors believe the recent revenue performance is enough to keep in line with the industry, which is keeping the P/S from dropping off. If not, then existing shareholders may be a little nervous about the viability of the share price.
We don't have analyst forecasts, but you can see how recent trends are setting up the company for the future by checking out our free report on SANVO Fine Chemicals Group's earnings, revenue and cash flow.How Is SANVO Fine Chemicals Group's Revenue Growth Trending?
SANVO Fine Chemicals Group's P/S ratio would be typical for a company that's only expected to deliver moderate growth, and importantly, perform in line with the industry.
Taking a look back first, the company's revenue growth last year wasn't something to get excited about as it posted a disappointing decline of 1.3%. This has soured the latest three-year period, which nevertheless managed to deliver a decent 8.2% overall rise in revenue. So we can start by confirming that the company has generally done a good job of growing revenue over that time, even though it had some hiccups along the way.
Comparing that to the industry, which is predicted to deliver 4.5% growth in the next 12 months, the company's momentum is pretty similar based on recent medium-term annualised revenue results.
With this in consideration, it's clear to see why SANVO Fine Chemicals Group's P/S matches up closely to its industry peers. Apparently shareholders are comfortable to simply hold on assuming the company will continue keeping a low profile.
The Bottom Line On SANVO Fine Chemicals Group's P/S
While the price-to-sales ratio shouldn't be the defining factor in whether you buy a stock or not, it's quite a capable barometer of revenue expectations.
As we've seen, SANVO Fine Chemicals Group's three-year revenue trends seem to be contributing to its P/S, given they look similar to current industry expectations. Currently, with a past revenue trend that aligns closely wit the industry outlook, shareholders are confident the company's future revenue outlook won't contain any major surprises. If recent medium-term revenue trends continue, it's hard to see the share price moving strongly in either direction in the near future under these circumstances.
You should always think about risks. Case in point, we've spotted 3 warning signs for SANVO Fine Chemicals Group you should be aware of, and 1 of them is significant.
If these risks are making you reconsider your opinion on SANVO Fine Chemicals Group, explore our interactive list of high quality stocks to get an idea of what else is out there.
New: Manage All Your Stock Portfolios in One Place
We've created the ultimate portfolio companion for stock investors, and it's free.
• Connect an unlimited number of Portfolios and see your total in one currency• Be alerted to new Warning Signs or Risks via email or mobile• Track the Fair Value of your stocks
Try a Demo Portfolio for FreeHave feedback on this article? Concerned about the content? Get in touch with us directly. Alternatively, email editorial-team (at) simplywallst.com.This article by Simply Wall St is general in nature. We provide commentary based on historical data and analyst forecasts only using an unbiased methodology and our articles are not intended to be financial advice. It does not constitute a recommendation to buy or sell any stock, and does not take account of your objectives, or your financial situation. We aim to bring you long-term focused analysis driven by fundamental data. Note that our analysis may not factor in the latest price-sensitive company announcements or qualitative material. Simply Wall St has no position in any stocks mentioned.
免責聲明:投資有風險,本文並非投資建議,以上內容不應被視為任何金融產品的購買或出售要約、建議或邀請,作者或其他用戶的任何相關討論、評論或帖子也不應被視為此類內容。本文僅供一般參考,不考慮您的個人投資目標、財務狀況或需求。TTM對信息的準確性和完整性不承擔任何責任或保證,投資者應自行研究並在投資前尋求專業建議。
熱議股票
- 1
- 2
- 3
- 4
- 5
- 6
- 7
- 8
- 9
- 10