SUI price defends key support despite recent token unlock 6 seconds ago
Sui price continues to hold above its key support zone despite the recent token unlock and is eyeing a potential bullish reversal if it can break above a key resistance level of $2.52.
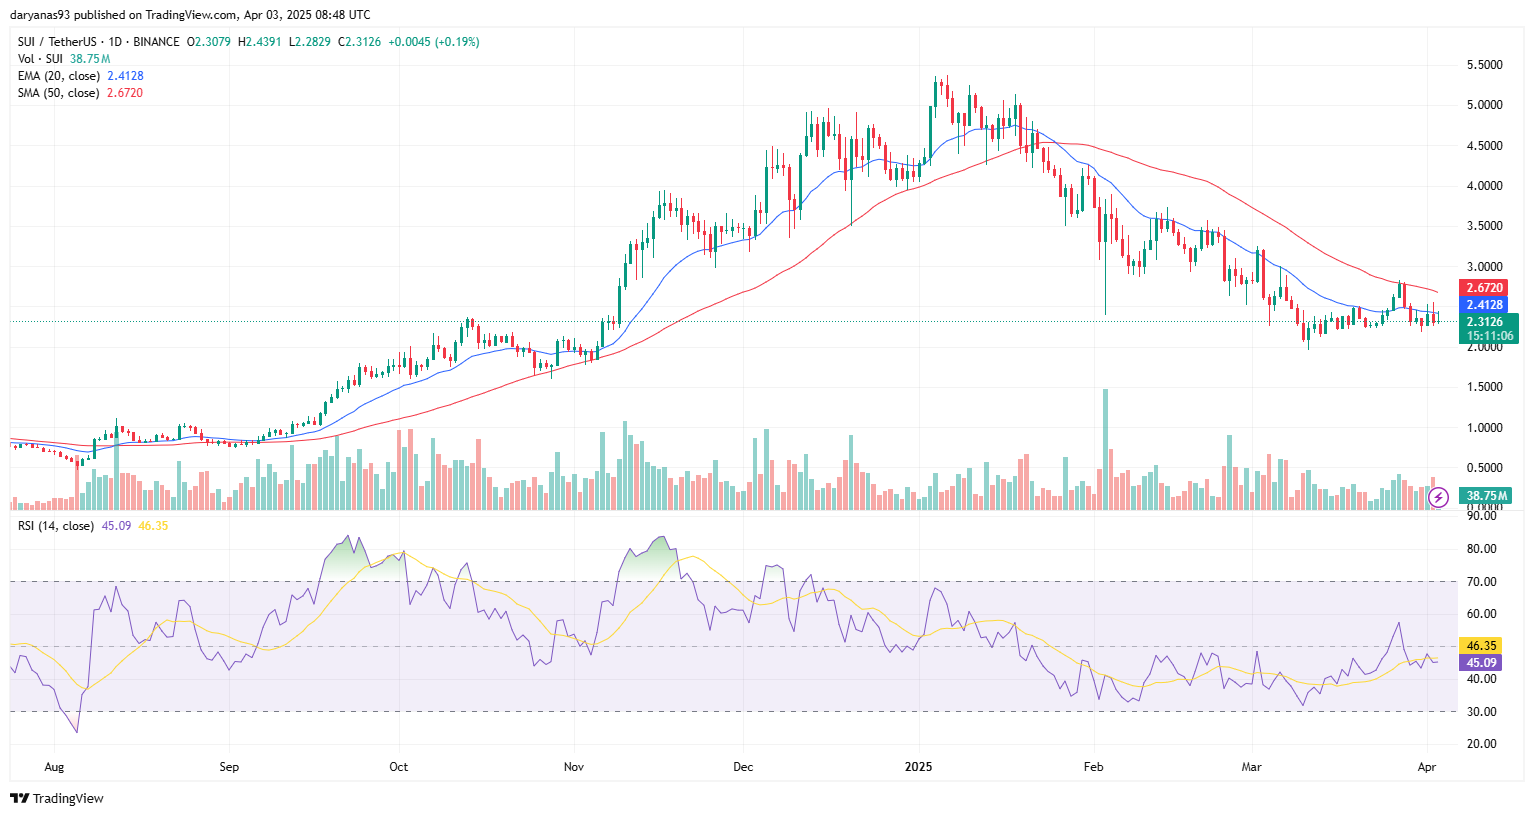
Sui (SUI) is currently trading at $2.31, hovering above the key support zone between $2.10 – $2.20, despite the recent token unlock on April 1. The price has been holding this level since March 11, after it had reached its lowest low of around $2 this year, following the crash from its all-time high of $5.35 on Jan. 6.
However, SUI price is still in a clear downtrend as it’s trading below both the 20-day Exponential Moving Average at $2.41 and 50-day Simple Moving Average at $2.67. The 20-day EMA is acting as immediate resistance, which SUI attempted to break it in late March and even briefly touched 50-day SMA, but faced rejection. RSI is at 45.09, meaning the momentum is weak but improving. RSI-based MA is at 46.35, showing that the strength of buyers is slowly increasing, but it’s still below the 50-neutral mark, so bulls aren’t in control yet. No major spike in volume is currently evident, meaning the market remains uncertain.

That being said, the chart is looking mildly bullish, especially considering that SUI has been holding above its key support zone between $2.10 – $2.20 for several weeks now. Plus, the price hasn’t made a new lower low since March 11 and has tested the 20-day EMA multiple times, meaning that buyers are challenging the short-term resistance. If the price continues to hold the current support and breaks out above the next resistance zone at $2.50 – $2.55, it could lead to a trend reversal, with the next major resistance at $2.67 (50-day SMA).
Similarly, technical analyst Ali Martinez recently noted that SUI price has formed an inverse head and shoulders pattern, which may point to a short-term bullish reversal if it breaks past $2.52.
免責聲明:投資有風險,本文並非投資建議,以上內容不應被視為任何金融產品的購買或出售要約、建議或邀請,作者或其他用戶的任何相關討論、評論或帖子也不應被視為此類內容。本文僅供一般參考,不考慮您的個人投資目標、財務狀況或需求。TTM對信息的準確性和完整性不承擔任何責任或保證,投資者應自行研究並在投資前尋求專業建議。
熱議股票
- 1
- 2
- 3
- 4
- 5
- 6
- 7
- 8
- 9
- 10