Investors Met With Slowing Returns on Capital At XXF Group Holdings (HKG:2473)
Did you know there are some financial metrics that can provide clues of a potential multi-bagger? Ideally, a business will show two trends; firstly a growing return on capital employed (ROCE) and secondly, an increasing amount of capital employed. If you see this, it typically means it's a company with a great business model and plenty of profitable reinvestment opportunities. That's why when we briefly looked at XXF Group Holdings' (HKG:2473) ROCE trend, we were pretty happy with what we saw.
This technology could replace computers: discover the 20 stocks are working to make quantum computing a reality.
Understanding Return On Capital Employed (ROCE)
For those who don't know, ROCE is a measure of a company's yearly pre-tax profit (its return), relative to the capital employed in the business. To calculate this metric for XXF Group Holdings, this is the formula:
Return on Capital Employed = Earnings Before Interest and Tax (EBIT) ÷ (Total Assets - Current Liabilities)
0.11 = CN¥215m ÷ (CN¥3.3b - CN¥1.3b) (Based on the trailing twelve months to December 2024).
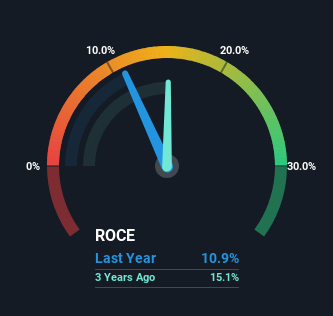
Thus, XXF Group Holdings has an ROCE of 11%. On its own, that's a standard return, however it's much better than the 9.1% generated by the Specialty Retail industry.
View our latest analysis for XXF Group Holdings
While the past is not representative of the future, it can be helpful to know how a company has performed historically, which is why we have this chart above. If you'd like to look at how XXF Group Holdings has performed in the past in other metrics, you can view this free graph of XXF Group Holdings' past earnings, revenue and cash flow .
What Does the ROCE Trend For XXF Group Holdings Tell Us?
The trend of ROCE doesn't stand out much, but returns on a whole are decent. The company has consistently earned 11% for the last four years, and the capital employed within the business has risen 88% in that time. Since 11% is a moderate ROCE though, it's good to see a business can continue to reinvest at these decent rates of return. Stable returns in this ballpark can be unexciting, but if they can be maintained over the long run, they often provide nice rewards to shareholders.
Another thing to note, XXF Group Holdings has a high ratio of current liabilities to total assets of 41%. This can bring about some risks because the company is basically operating with a rather large reliance on its suppliers or other sorts of short-term creditors. Ideally we'd like to see this reduce as that would mean fewer obligations bearing risks.
In Conclusion...
To sum it up, XXF Group Holdings has simply been reinvesting capital steadily, at those decent rates of return. And long term investors would be thrilled with the 598% return they've received over the last year. So while the positive underlying trends may be accounted for by investors, we still think this stock is worth looking into further.
XXF Group Holdings does come with some risks though, we found 2 warning signs in our investment analysis, and 1 of those is a bit concerning...
For those who like to invest in solid companies, check out this free list of companies with solid balance sheets and high returns on equity.
New: AI Stock Screener & Alerts
Our new AI Stock Screener scans the market every day to uncover opportunities.
• Dividend Powerhouses (3%+ Yield)• Undervalued Small Caps with Insider Buying• High growth Tech and AI CompaniesOr build your own from over 50 metrics.
Explore Now for FreeHave feedback on this article? Concerned about the content? Get in touch with us directly. Alternatively, email editorial-team (at) simplywallst.com.This article by Simply Wall St is general in nature. We provide commentary based on historical data and analyst forecasts only using an unbiased methodology and our articles are not intended to be financial advice. It does not constitute a recommendation to buy or sell any stock, and does not take account of your objectives, or your financial situation. We aim to bring you long-term focused analysis driven by fundamental data. Note that our analysis may not factor in the latest price-sensitive company announcements or qualitative material. Simply Wall St has no position in any stocks mentioned.
免責聲明:投資有風險,本文並非投資建議,以上內容不應被視為任何金融產品的購買或出售要約、建議或邀請,作者或其他用戶的任何相關討論、評論或帖子也不應被視為此類內容。本文僅供一般參考,不考慮您的個人投資目標、財務狀況或需求。TTM對信息的準確性和完整性不承擔任何責任或保證,投資者應自行研究並在投資前尋求專業建議。
熱議股票
- 1
- 2
- 3
- 4
- 5
- 6
- 7
- 8
- 9
- 10