With A 26% Price Drop For Pacific Radiance Ltd. (SGX:RXS) You'll Still Get What You Pay For
Pacific Radiance Ltd. (SGX:RXS) shareholders that were waiting for something to happen have been dealt a blow with a 26% share price drop in the last month. Instead of being rewarded, shareholders who have already held through the last twelve months are now sitting on a 15% share price drop.
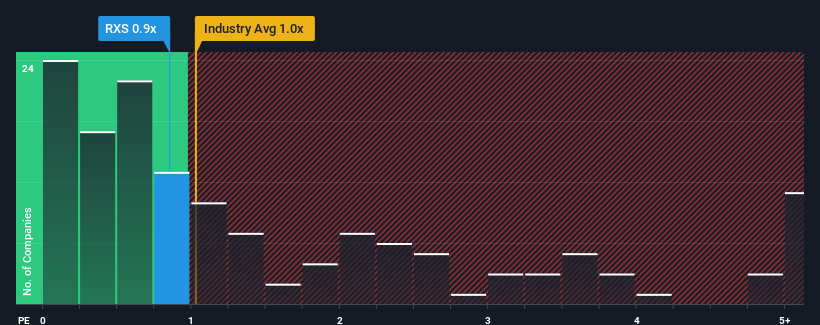
Although its price has dipped substantially, there still wouldn't be many who think Pacific Radiance's price-to-sales (or "P/S") ratio of 0.9x is worth a mention when the median P/S in Singapore's Energy Services industry is similar at about 0.5x. However, investors might be overlooking a clear opportunity or potential setback if there is no rational basis for the P/S.
Trump has pledged to "unleash" American oil and gas and these 15 US stocks have developments that are poised to benefit.
Check out our latest analysis for Pacific Radiance
What Does Pacific Radiance's Recent Performance Look Like?
With revenue growth that's superior to most other companies of late, Pacific Radiance has been doing relatively well. One possibility is that the P/S ratio is moderate because investors think this strong revenue performance might be about to tail off. If the company manages to stay the course, then investors should be rewarded with a share price that matches its revenue figures.
Want the full picture on analyst estimates for the company? Then our free report on Pacific Radiance will help you uncover what's on the horizon.Is There Some Revenue Growth Forecasted For Pacific Radiance?
Pacific Radiance's P/S ratio would be typical for a company that's only expected to deliver moderate growth, and importantly, perform in line with the industry.
If we review the last year of revenue growth, the company posted a terrific increase of 40%. This great performance means it was also able to deliver immense revenue growth over the last three years. Therefore, it's fair to say the revenue growth recently has been superb for the company.
Looking ahead now, revenue is anticipated to climb by 6.9% per annum during the coming three years according to the two analysts following the company. That's shaping up to be similar to the 7.5% each year growth forecast for the broader industry.
With this in mind, it makes sense that Pacific Radiance's P/S is closely matching its industry peers. Apparently shareholders are comfortable to simply hold on while the company is keeping a low profile.
The Bottom Line On Pacific Radiance's P/S
Pacific Radiance's plummeting stock price has brought its P/S back to a similar region as the rest of the industry. While the price-to-sales ratio shouldn't be the defining factor in whether you buy a stock or not, it's quite a capable barometer of revenue expectations.
We've seen that Pacific Radiance maintains an adequate P/S seeing as its revenue growth figures match the rest of the industry. At this stage investors feel the potential for an improvement or deterioration in revenue isn't great enough to push P/S in a higher or lower direction. All things considered, if the P/S and revenue estimates contain no major shocks, then it's hard to see the share price moving strongly in either direction in the near future.
It is also worth noting that we have found 3 warning signs for Pacific Radiance (2 shouldn't be ignored!) that you need to take into consideration.
If you're unsure about the strength of Pacific Radiance's business, why not explore our interactive list of stocks with solid business fundamentals for some other companies you may have missed.
If you're looking to trade Pacific Radiance, open an account with the lowest-cost platform trusted by professionals, Interactive Brokers.
With clients in over 200 countries and territories, and access to 160 markets, IBKR lets you trade stocks, options, futures, forex, bonds and funds from a single integrated account.
Enjoy no hidden fees, no account minimums, and FX conversion rates as low as 0.03%, far better than what most brokers offer.
Sponsored ContentNew: Manage All Your Stock Portfolios in One Place
We've created the ultimate portfolio companion for stock investors, and it's free.
• Connect an unlimited number of Portfolios and see your total in one currency• Be alerted to new Warning Signs or Risks via email or mobile• Track the Fair Value of your stocks
Try a Demo Portfolio for FreeHave feedback on this article? Concerned about the content? Get in touch with us directly. Alternatively, email editorial-team (at) simplywallst.com.This article by Simply Wall St is general in nature. We provide commentary based on historical data and analyst forecasts only using an unbiased methodology and our articles are not intended to be financial advice. It does not constitute a recommendation to buy or sell any stock, and does not take account of your objectives, or your financial situation. We aim to bring you long-term focused analysis driven by fundamental data. Note that our analysis may not factor in the latest price-sensitive company announcements or qualitative material. Simply Wall St has no position in any stocks mentioned.
免責聲明:投資有風險,本文並非投資建議,以上內容不應被視為任何金融產品的購買或出售要約、建議或邀請,作者或其他用戶的任何相關討論、評論或帖子也不應被視為此類內容。本文僅供一般參考,不考慮您的個人投資目標、財務狀況或需求。TTM對信息的準確性和完整性不承擔任何責任或保證,投資者應自行研究並在投資前尋求專業建議。
熱議股票
- 1
- 2
- 3
- 4
- 5
- 6
- 7
- 8
- 9
- 10