Bitcoin price slips, but pattern suggests calm before the storm 3 minutes ago
Bitcoin price remained under pressure on Thursday, briefly trading below $102,000 as the recent rally took a breather.
Bitcoin (BTC) was trading at $102,716 at press time, down 3.35% from its highest point this year. This retreat triggered a steeper sell-off among altcoins like Ethereum (ETH), Solana (SOL), and Polkadot (DOT).
Bitcoin’s performance mirrored the broader stock market, as futures tied to the Dow Jones, Nasdaq 100, and S&P 500 indices fell by more than 0.50%. There was no immediate catalyst for the ongoing Bitcoin price retreat, suggesting that traders are taking profits after a more than 40% rally from April’s lows.
Bitcoin continues to maintain strong fundamentals as demand rises and supply remains under pressure. Data shows that spot Bitcoin ETFs attracted over $319 million in inflows on Wednesday, bringing the total amount since inception to $41.40 billion.
Michael Saylor’s Strategy is continuing with its accumulation, while Ukraine is considering strategic Bitcoin reserves. Ukraine holds over 46,500 coins valued at over $4.7 billion, making it the fourth-biggest holder after the US, China, and the UK.
Bitcoin’s mining difficulty and hash rate have been trending upward, while supply on exchanges has fallen to its lowest level in over six years. As a result, the combination of rising demand, declining supply, and a soaring global M2 money supply increases the likelihood that Bitcoin’s price will continue to rise.
Bitcoin price chart points to more gains

crypto.news made a bullish Bitcoin price forecast on Wednesday, pointing to the cup-and-handle pattern on the daily chart.
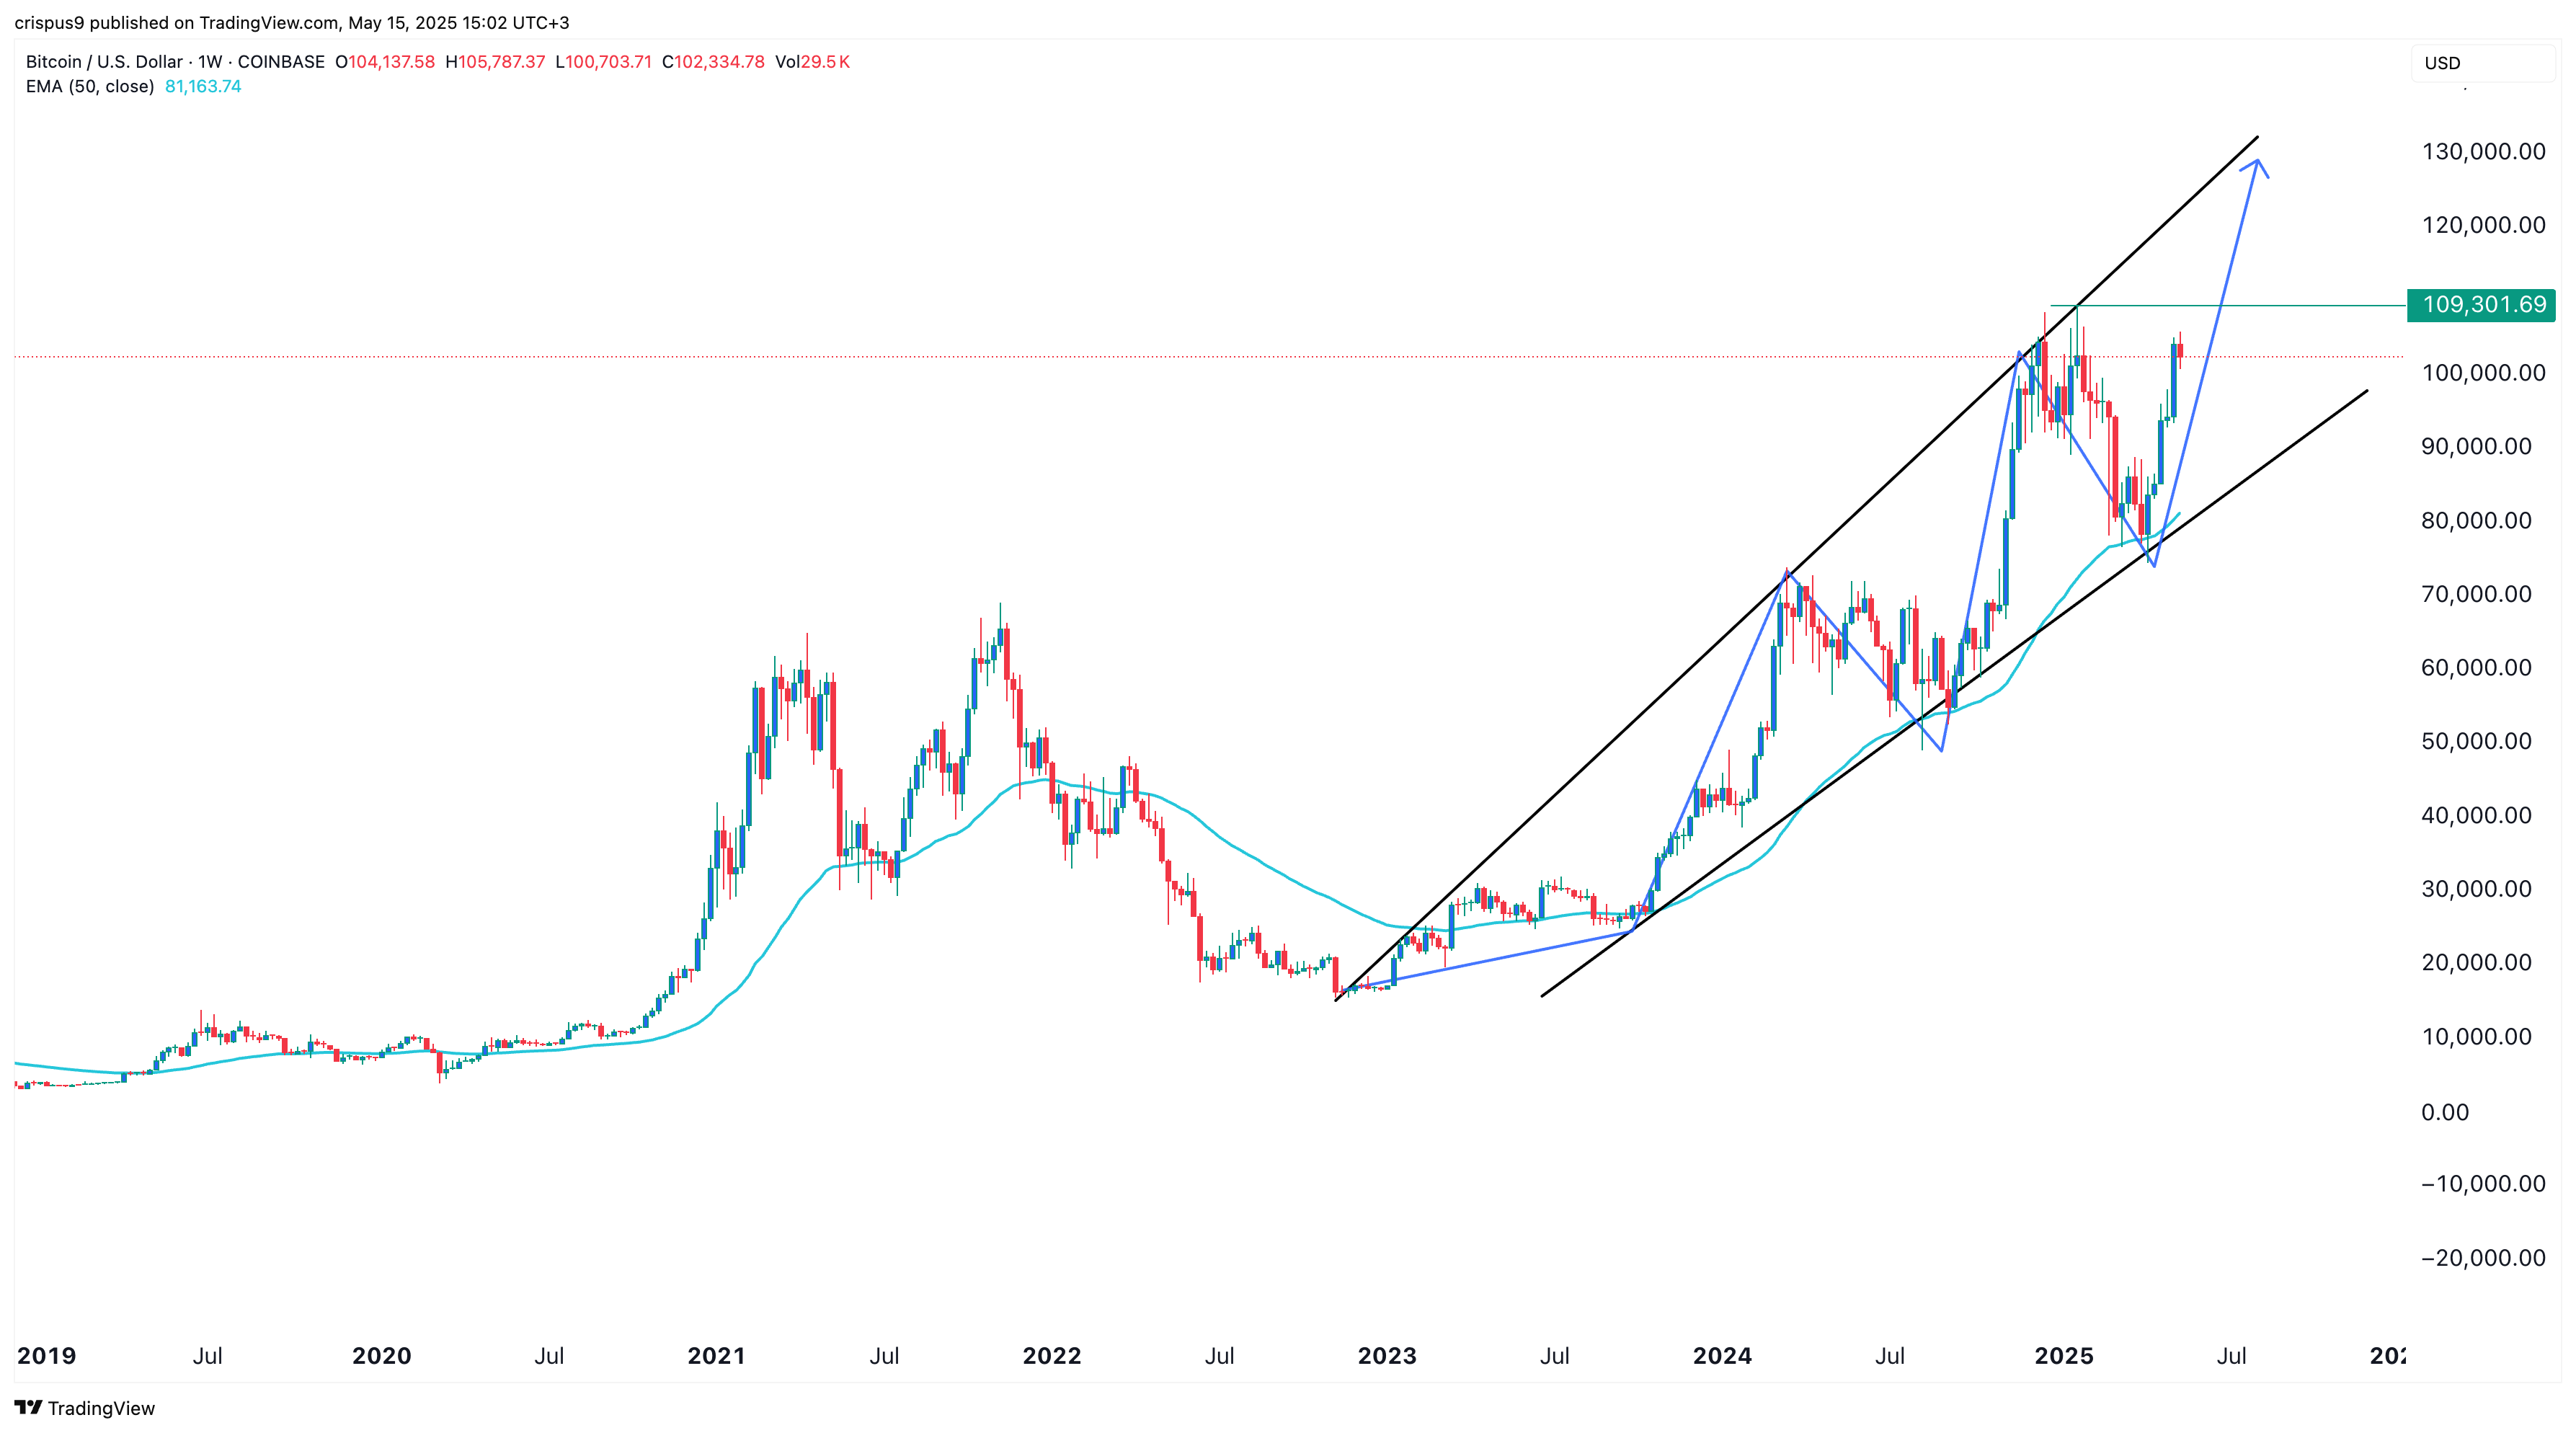
The weekly chart suggests further gains in the coming months. It shows that Bitcoin’s price has consistently remained above the 50-week Exponential Moving Average and has not moved below it since October 2023.
Bitcoin has also formed a giant megaphone pattern, composed of two rising and diverging trendlines. This pattern often precedes a strong bull run. In this case, the rally will be confirmed if price breaks above the all-time high of $109,300.
If that happens, the next level to watch will be the psychological barrier at $110,000, followed by $115,000. However, the bullish forecast would be invalidated if the coin drops below the lower boundary of the megaphone pattern.
免責聲明:投資有風險,本文並非投資建議,以上內容不應被視為任何金融產品的購買或出售要約、建議或邀請,作者或其他用戶的任何相關討論、評論或帖子也不應被視為此類內容。本文僅供一般參考,不考慮您的個人投資目標、財務狀況或需求。TTM對信息的準確性和完整性不承擔任何責任或保證,投資者應自行研究並在投資前尋求專業建議。
熱議股票
- 1
- 2
- 3
- 4
- 5
- 6
- 7
- 8
- 9
- 10