Three reasons why the soaring SPX crypto token could crash soon
The SPX6900 token has been in a strong uptrend since March, making it one of the top gainers in crypto.
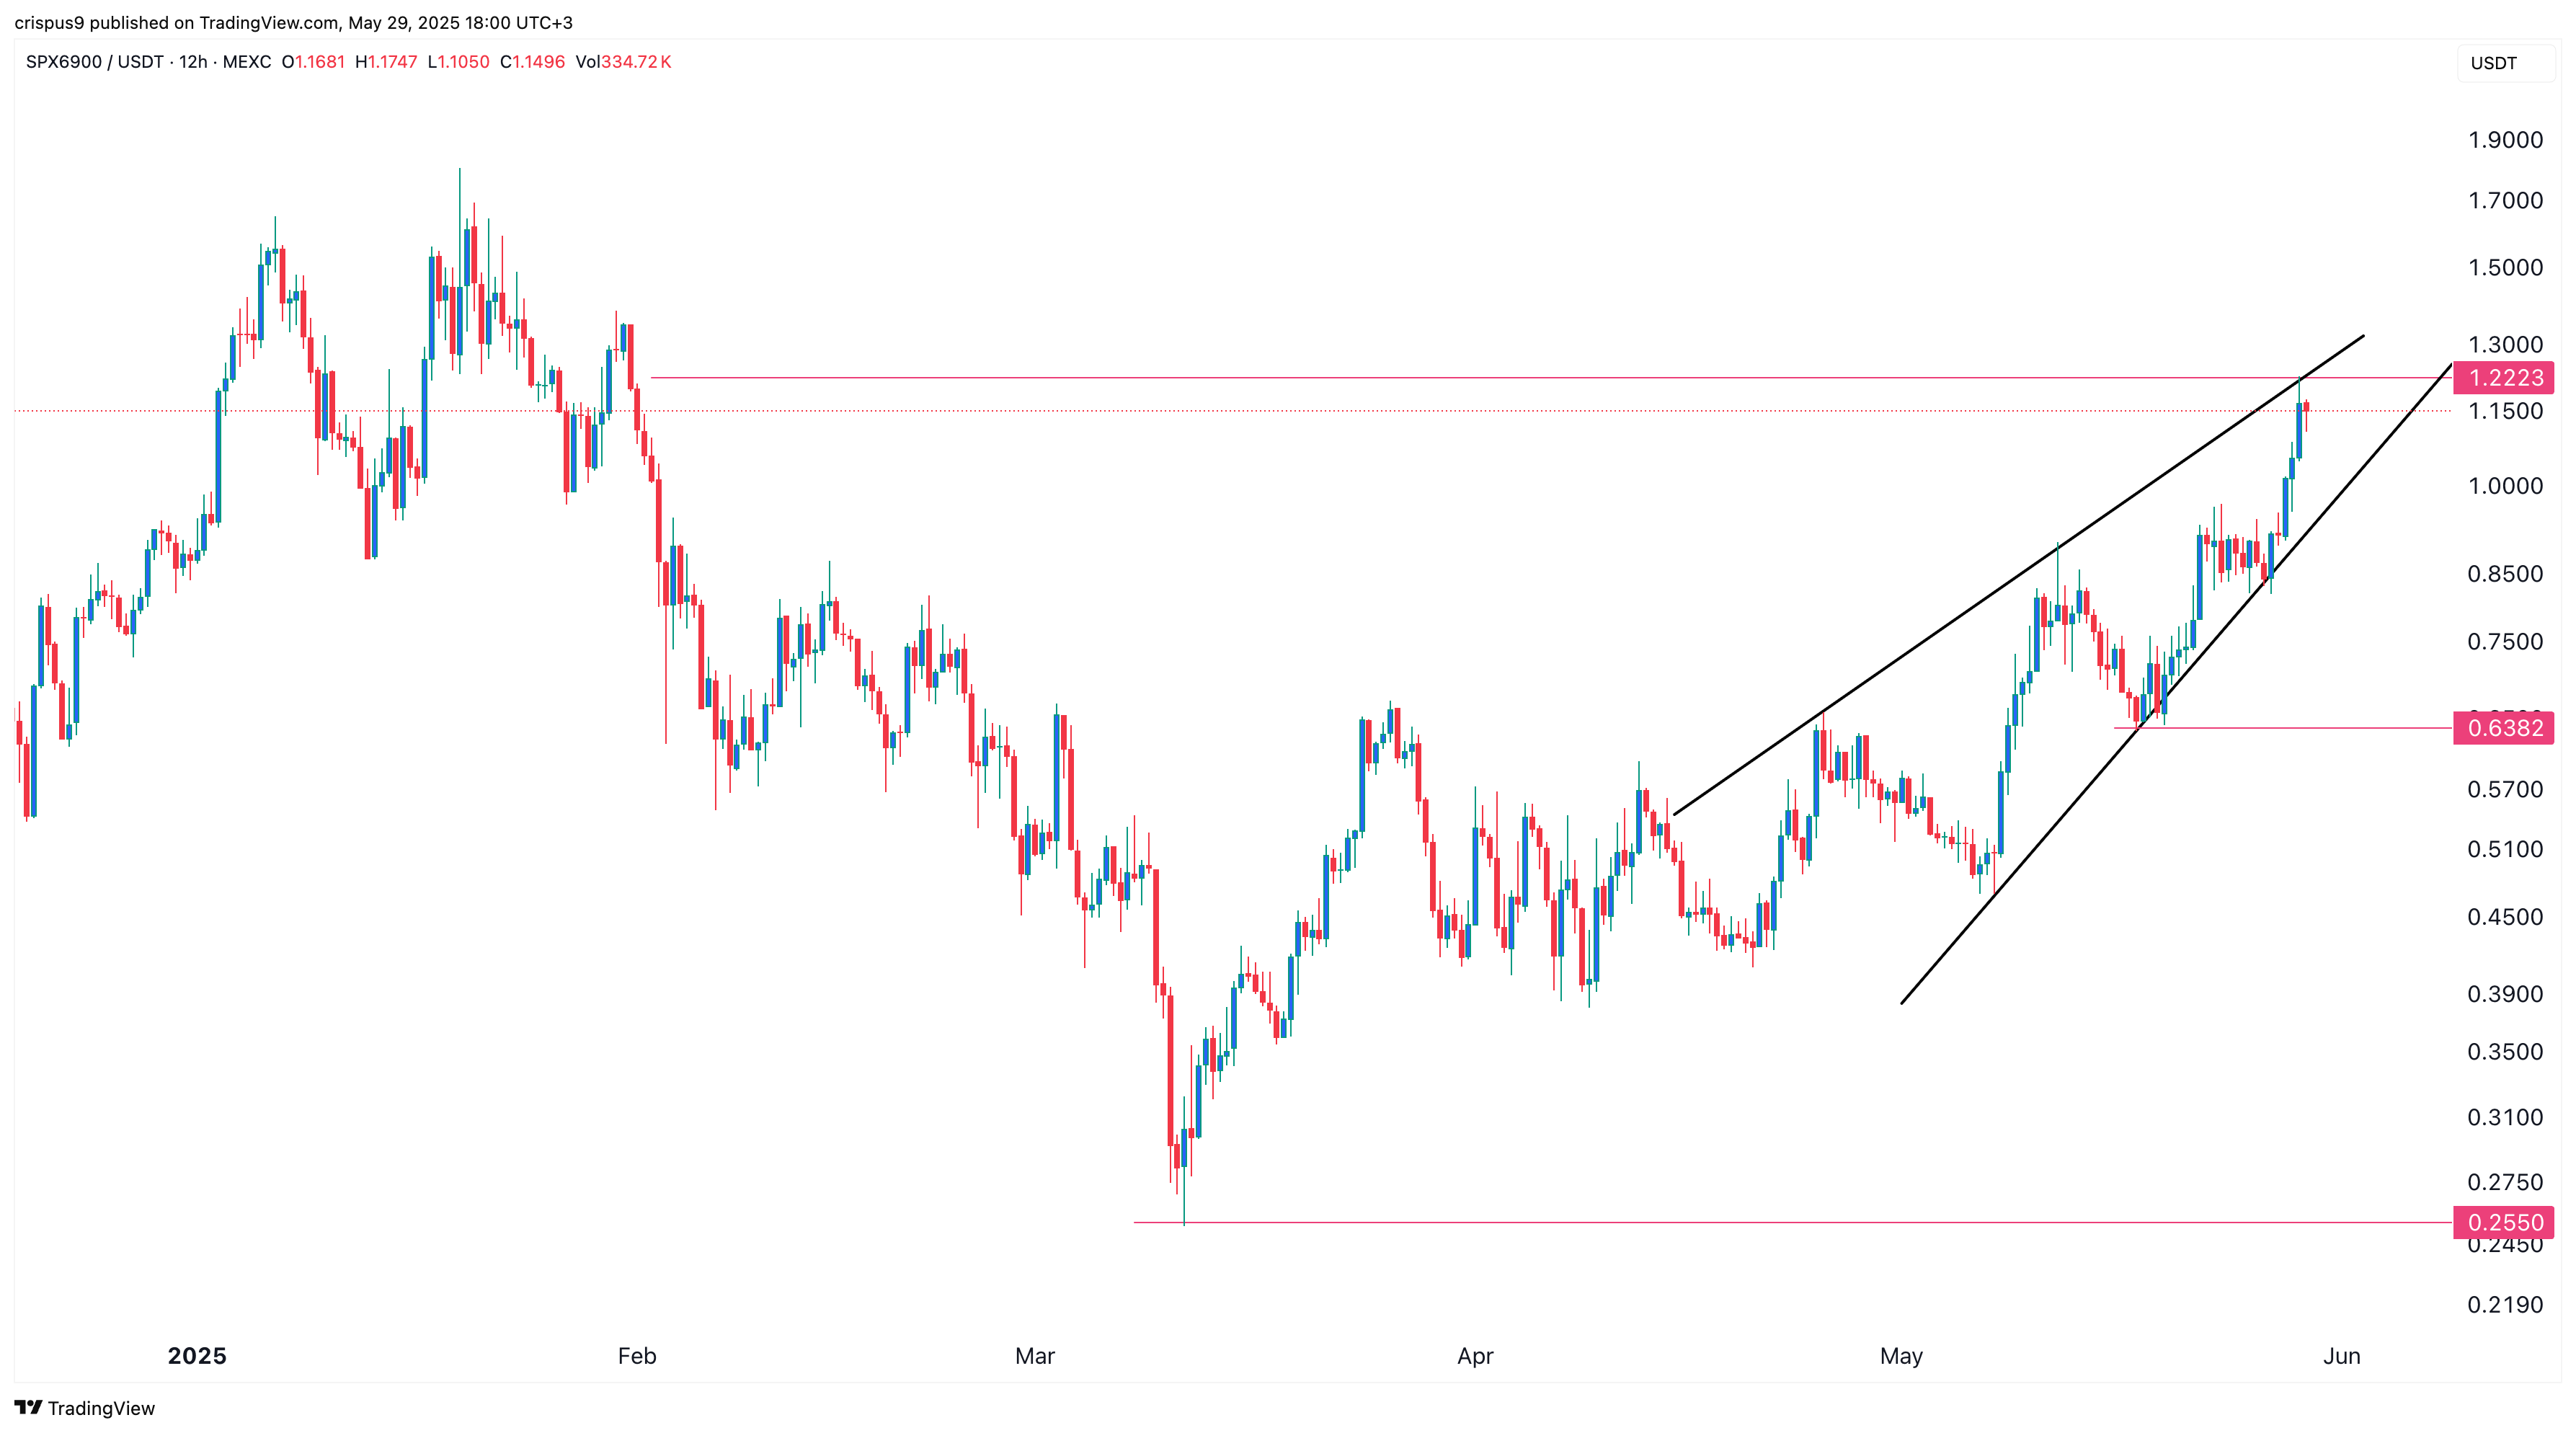
SPX6900 (SPX) price jumped to a high of $1.222 on May 29, the highest point since January. It has soared by almost 350% from its March low, bringing its valuation to over $1 billion. It is now the eighth-largest meme coin in the crypto industry.
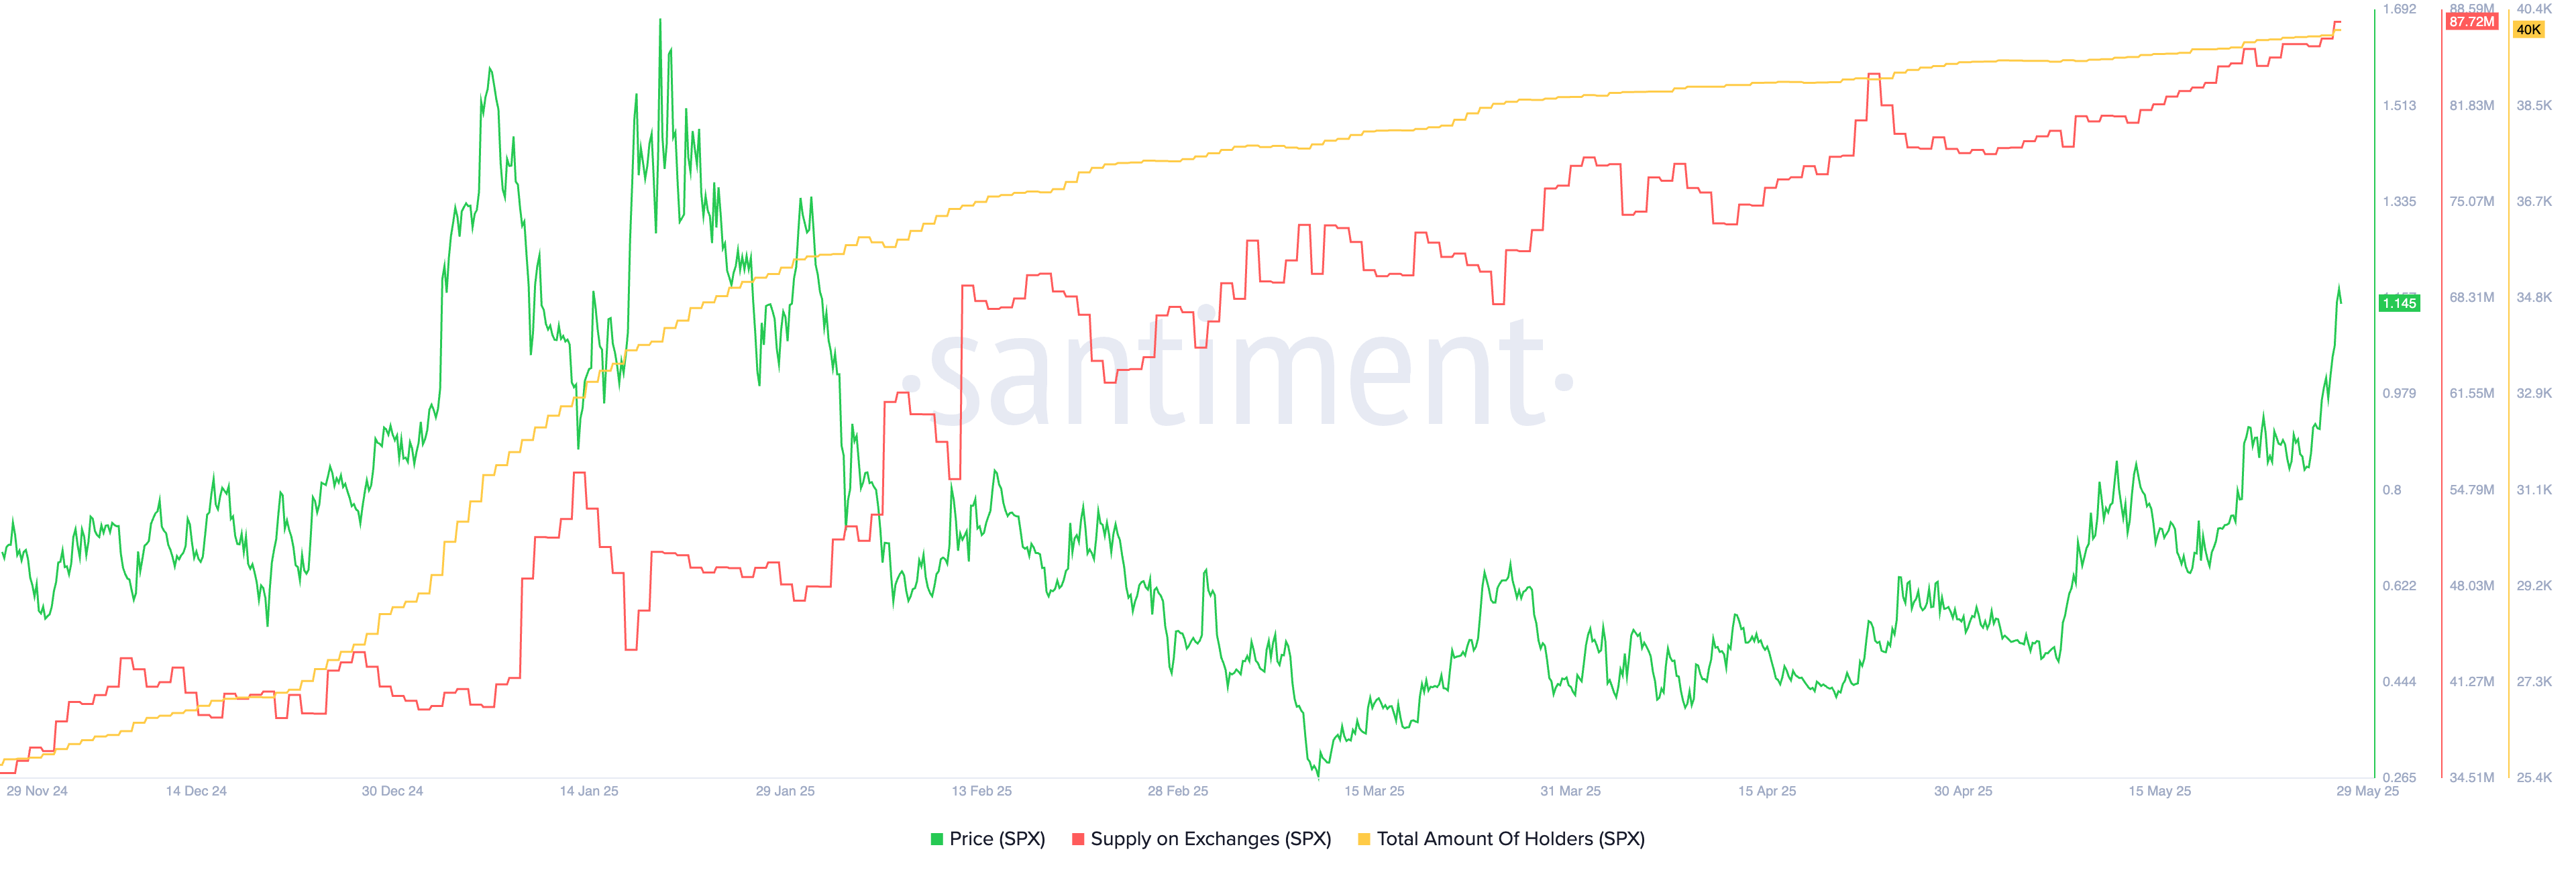
SPX6900 has surged due to fear of missing out among investors, driving its total number of holders to 40,000 from 29,000 on January 1. This FOMO is also reflected in the rising number of social media mentions.
While SPX has flipped the key resistance level at $1, there are several fundamental and technical reasons why it may crash in the coming days or weeks.
First, Santiment data shows that the supply of SPX tokens on exchanges has continued to rise this month. There are now 87 million tokens on exchanges, up from the January low of 41 million. Nansen reports the exchange supply at 141 million, a 6.5% monthly increase.
An increase in tokens on exchanges typically indicates that investors are beginning to take profits after a sharp rally.

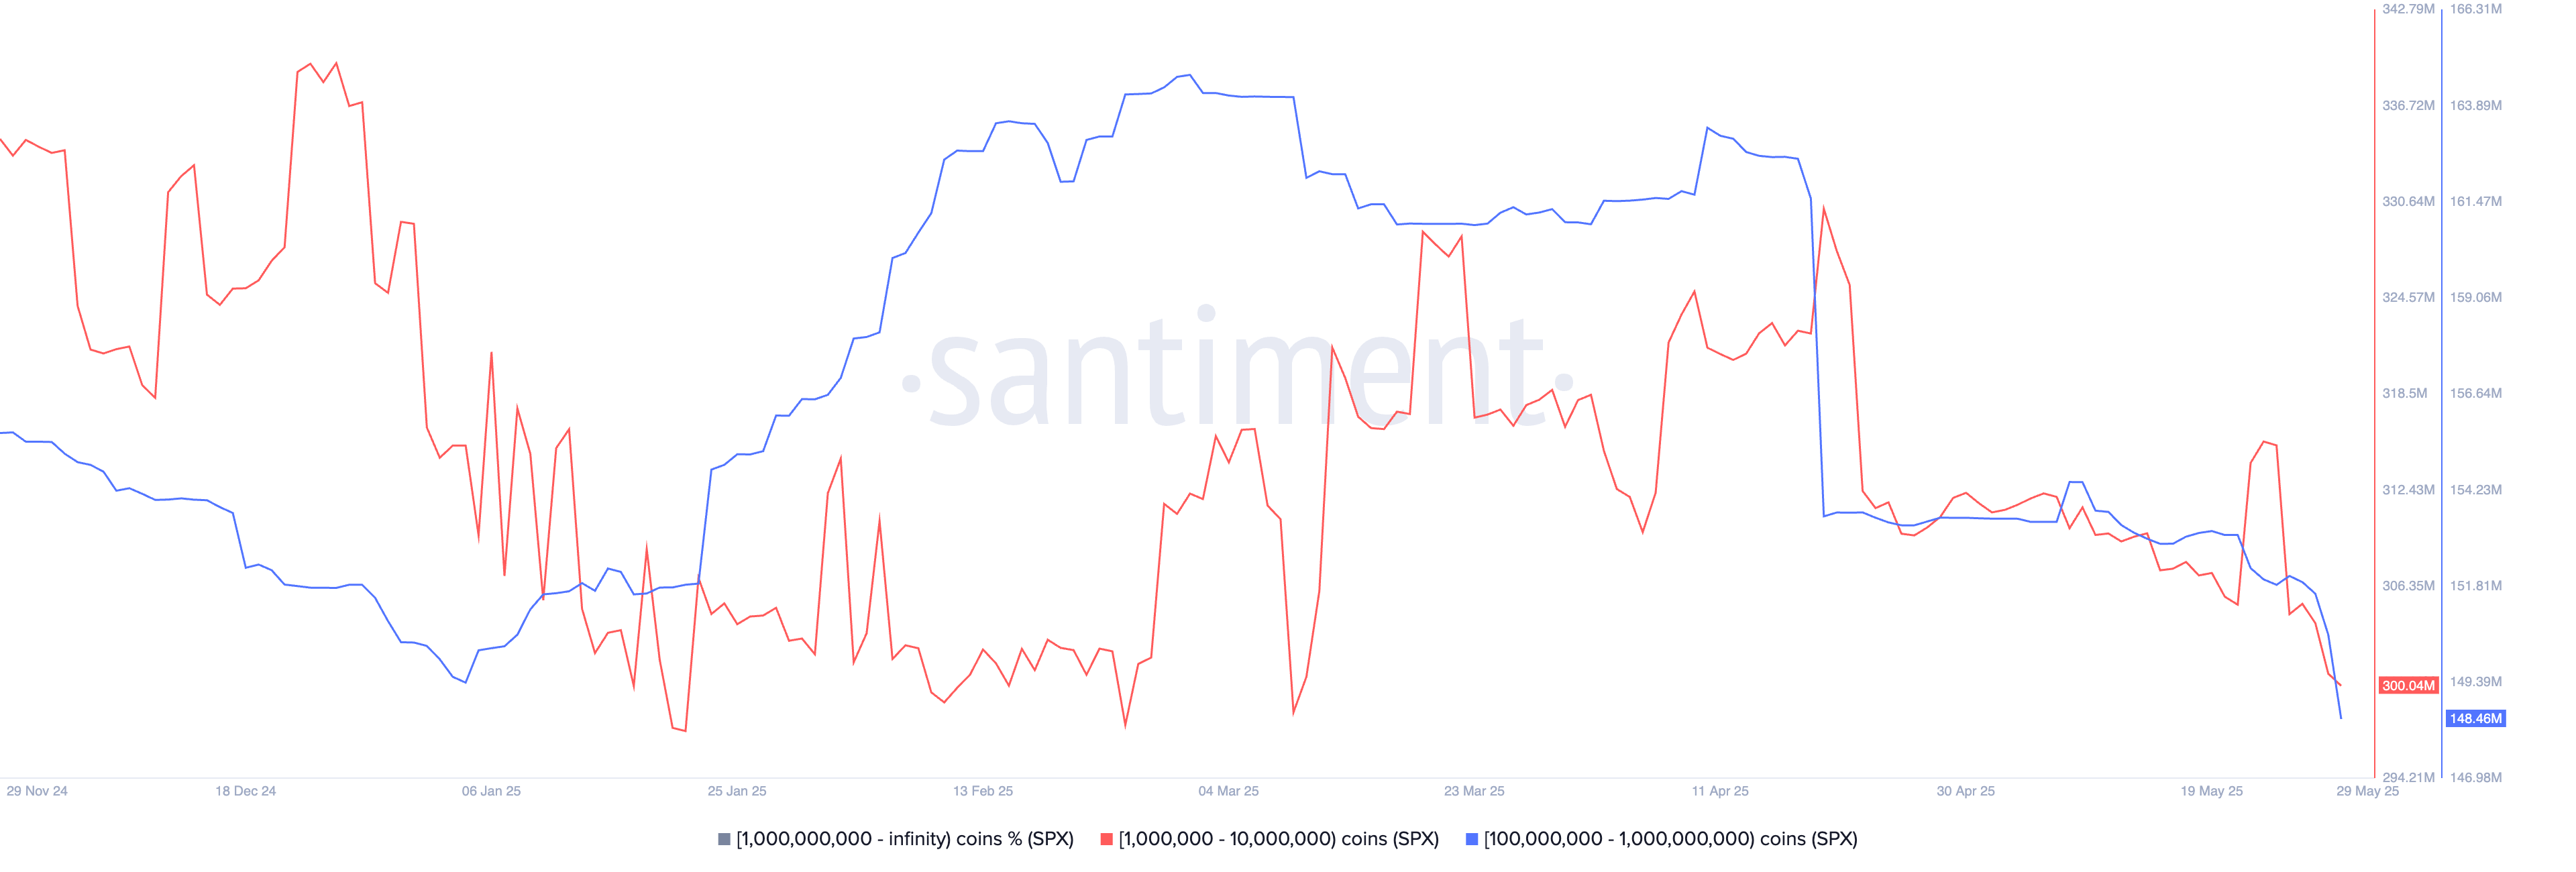
Second, SPX may face further downside pressure as whale sales accelerate. Holders with between 1 million and 10 million tokens now hold 300 million SPX6900 coins, down from 330 million last month. Similarly, those holding between 100 million and 1 billion tokens have reduced their holdings to 148 million from April’s 163 million.

Additional Nansen data shows that smart money investors now hold 4.6 million SPX coins, a 10% monthly decline. Their holdings have dropped to a record low, indicating that they expect further downside.
SPX price technical analysis

A final technical reason SPX may decline is the formation of a rising wedge pattern on the 12-hour chart. The lower trendline connects the lowest swings since May 7, while the upper trendline links the highest swings since April 14.
These two lines are now nearing a confluence point, which could result in a strong bearish breakdown in the coming days. If that occurs, the first support level to watch is $1.00, followed by $0.6383, the lowest swing on May 18.
免責聲明:投資有風險,本文並非投資建議,以上內容不應被視為任何金融產品的購買或出售要約、建議或邀請,作者或其他用戶的任何相關討論、評論或帖子也不應被視為此類內容。本文僅供一般參考,不考慮您的個人投資目標、財務狀況或需求。TTM對信息的準確性和完整性不承擔任何責任或保證,投資者應自行研究並在投資前尋求專業建議。
熱議股票
- 1
- 2
- 3
- 4
- 5
- 6
- 7
- 8
- 9
- 10