What Installed Building Products, Inc.'s (NYSE:IBP) P/E Is Not Telling You
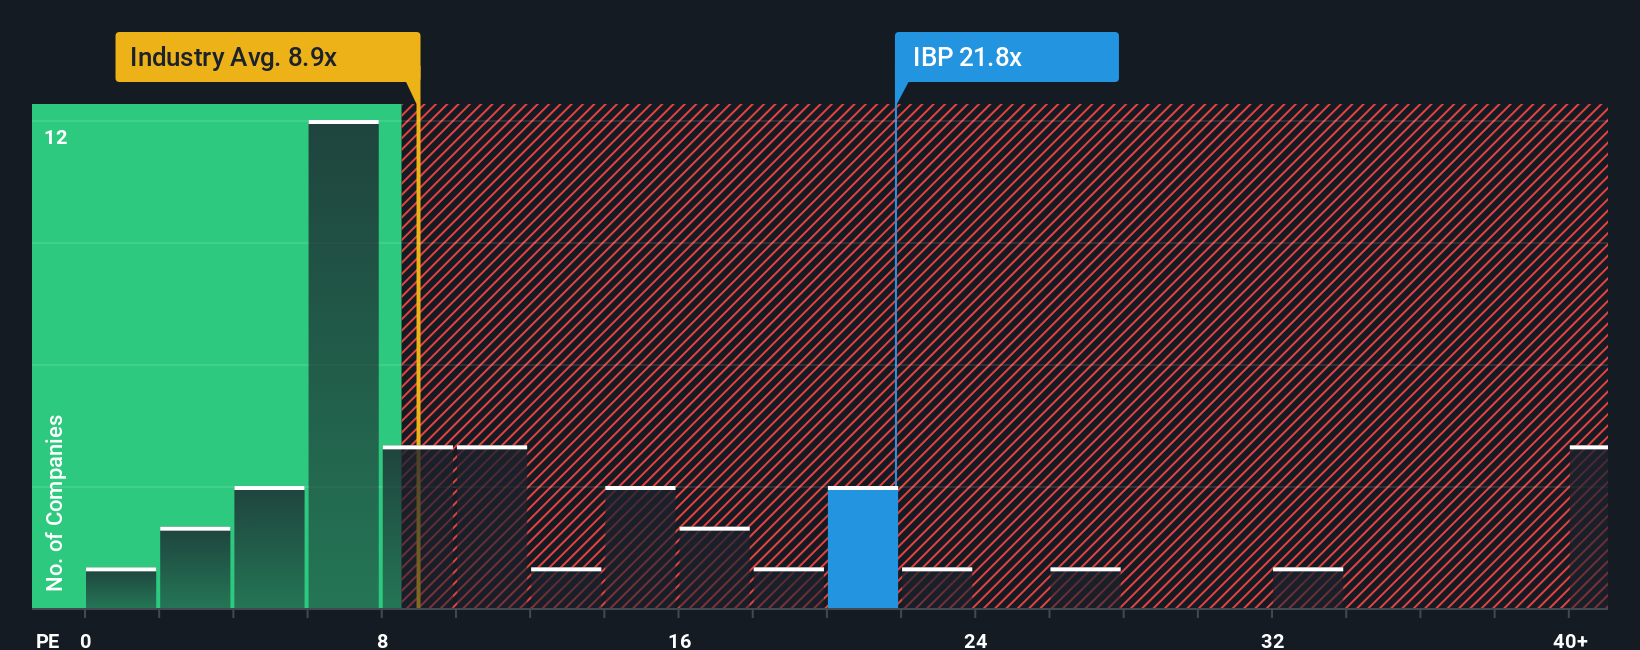
When close to half the companies in the United States have price-to-earnings ratios (or "P/E's") below 18x, you may consider Installed Building Products, Inc. (NYSE:IBP) as a stock to potentially avoid with its 21.8x P/E ratio. Nonetheless, we'd need to dig a little deeper to determine if there is a rational basis for the elevated P/E.
Trump has pledged to "unleash" American oil and gas and these 15 US stocks have developments that are poised to benefit.
Installed Building Products hasn't been tracking well recently as its declining earnings compare poorly to other companies, which have seen some growth on average. It might be that many expect the dour earnings performance to recover substantially, which has kept the P/E from collapsing. You'd really hope so, otherwise you're paying a pretty hefty price for no particular reason.
View our latest analysis for Installed Building Products
How Is Installed Building Products' Growth Trending?
The only time you'd be truly comfortable seeing a P/E as high as Installed Building Products' is when the company's growth is on track to outshine the market.
Retrospectively, the last year delivered virtually the same number to the company's bottom line as the year before. Although pleasingly EPS has lifted 95% in aggregate from three years ago, notwithstanding the last 12 months. Therefore, it's fair to say the earnings growth recently has been superb for the company.
Looking ahead now, EPS is anticipated to slump, contracting by 6.8% during the coming year according to the eleven analysts following the company. With the market predicted to deliver 13% growth , that's a disappointing outcome.
In light of this, it's alarming that Installed Building Products' P/E sits above the majority of other companies. It seems most investors are hoping for a turnaround in the company's business prospects, but the analyst cohort is not so confident this will happen. Only the boldest would assume these prices are sustainable as these declining earnings are likely to weigh heavily on the share price eventually.
What We Can Learn From Installed Building Products' P/E?
While the price-to-earnings ratio shouldn't be the defining factor in whether you buy a stock or not, it's quite a capable barometer of earnings expectations.
We've established that Installed Building Products currently trades on a much higher than expected P/E for a company whose earnings are forecast to decline. When we see a poor outlook with earnings heading backwards, we suspect the share price is at risk of declining, sending the high P/E lower. Unless these conditions improve markedly, it's very challenging to accept these prices as being reasonable.
Plus, you should also learn about these 2 warning signs we've spotted with Installed Building Products (including 1 which is significant).
If these risks are making you reconsider your opinion on Installed Building Products, explore our interactive list of high quality stocks to get an idea of what else is out there.
New: AI Stock Screener & Alerts
Our new AI Stock Screener scans the market every day to uncover opportunities.
• Dividend Powerhouses (3%+ Yield)• Undervalued Small Caps with Insider Buying• High growth Tech and AI CompaniesOr build your own from over 50 metrics.
Explore Now for FreeHave feedback on this article? Concerned about the content? Get in touch with us directly. Alternatively, email editorial-team (at) simplywallst.com.This article by Simply Wall St is general in nature. We provide commentary based on historical data and analyst forecasts only using an unbiased methodology and our articles are not intended to be financial advice. It does not constitute a recommendation to buy or sell any stock, and does not take account of your objectives, or your financial situation. We aim to bring you long-term focused analysis driven by fundamental data. Note that our analysis may not factor in the latest price-sensitive company announcements or qualitative material. Simply Wall St has no position in any stocks mentioned.
免責聲明:投資有風險,本文並非投資建議,以上內容不應被視為任何金融產品的購買或出售要約、建議或邀請,作者或其他用戶的任何相關討論、評論或帖子也不應被視為此類內容。本文僅供一般參考,不考慮您的個人投資目標、財務狀況或需求。TTM對信息的準確性和完整性不承擔任何責任或保證,投資者應自行研究並在投資前尋求專業建議。
熱議股票
- 1
- 2
- 3
- 4
- 5
- 6
- 7
- 8
- 9
- 10