TEGNA Inc. (NYSE:TGNA) Looks Inexpensive But Perhaps Not Attractive Enough
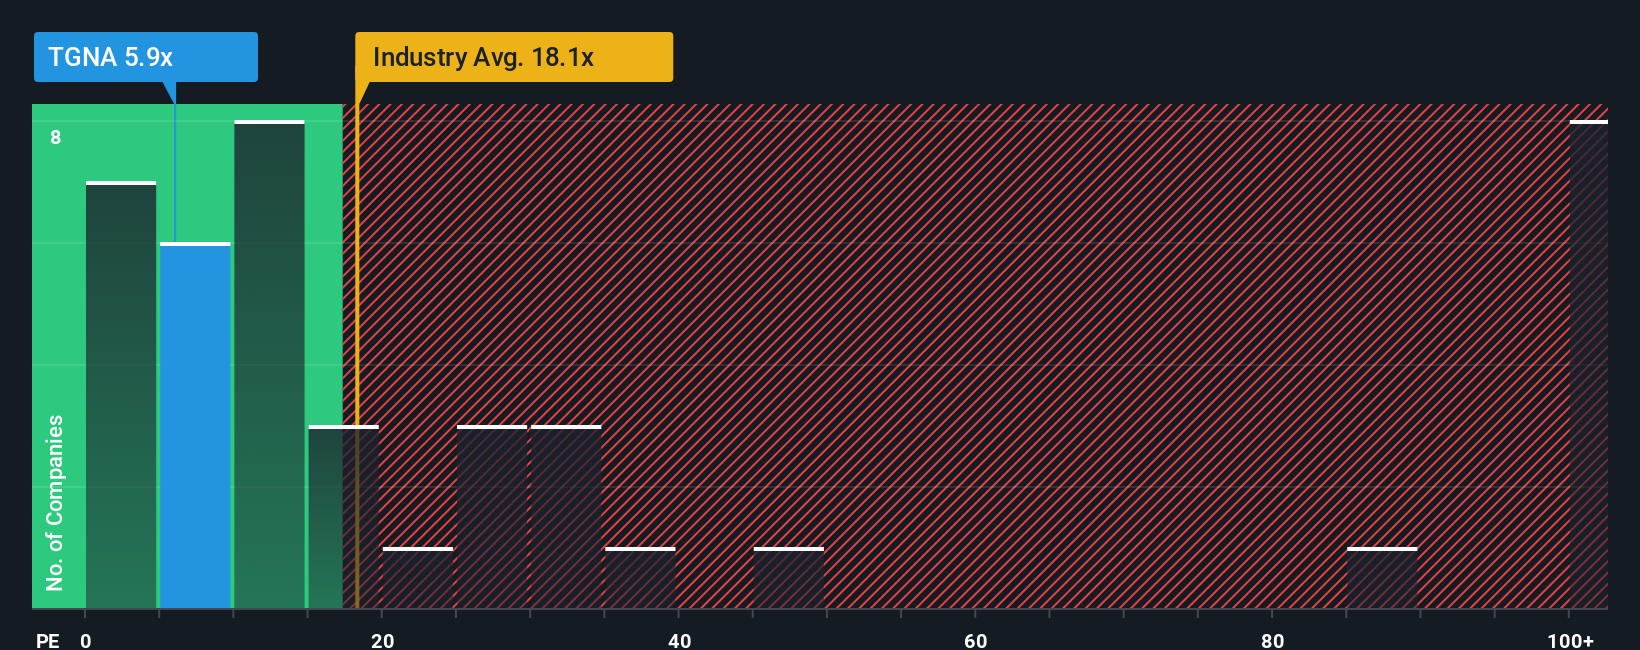
TEGNA Inc.'s (NYSE:TGNA) price-to-earnings (or "P/E") ratio of 5.9x might make it look like a strong buy right now compared to the market in the United States, where around half of the companies have P/E ratios above 19x and even P/E's above 34x are quite common. However, the P/E might be quite low for a reason and it requires further investigation to determine if it's justified.
AI is about to change healthcare. These 20 stocks are working on everything from early diagnostics to drug discovery. The best part - they are all under $10bn in marketcap - there is still time to get in early.
TEGNA could be doing better as its earnings have been going backwards lately while most other companies have been seeing positive earnings growth. The P/E is probably low because investors think this poor earnings performance isn't going to get any better. If you still like the company, you'd be hoping this isn't the case so that you could potentially pick up some stock while it's out of favour.
See our latest analysis for TEGNA
How Is TEGNA's Growth Trending?
The only time you'd be truly comfortable seeing a P/E as depressed as TEGNA's is when the company's growth is on track to lag the market decidedly.
If we review the last year of earnings, the company posted a result that saw barely any deviation from a year ago. Still, the latest three year period was better as it's delivered a decent 29% overall rise in EPS. Accordingly, shareholders probably wouldn't have been overly satisfied with the unstable medium-term growth rates.
Looking ahead now, EPS is anticipated to slump, contracting by 10% each year during the coming three years according to the six analysts following the company. That's not great when the rest of the market is expected to grow by 10% per annum.
With this information, we are not surprised that TEGNA is trading at a P/E lower than the market. Nonetheless, there's no guarantee the P/E has reached a floor yet with earnings going in reverse. Even just maintaining these prices could be difficult to achieve as the weak outlook is weighing down the shares.
The Final Word
It's argued the price-to-earnings ratio is an inferior measure of value within certain industries, but it can be a powerful business sentiment indicator.
As we suspected, our examination of TEGNA's analyst forecasts revealed that its outlook for shrinking earnings is contributing to its low P/E. Right now shareholders are accepting the low P/E as they concede future earnings probably won't provide any pleasant surprises. Unless these conditions improve, they will continue to form a barrier for the share price around these levels.
Plus, you should also learn about these 3 warning signs we've spotted with TEGNA (including 1 which is a bit concerning).
Of course, you might also be able to find a better stock than TEGNA. So you may wish to see this free collection of other companies that have reasonable P/E ratios and have grown earnings strongly.
Valuation is complex, but we're here to simplify it.
Discover if TEGNA might be undervalued or overvalued with our detailed analysis, featuring fair value estimates, potential risks, dividends, insider trades, and its financial condition.
Access Free AnalysisHave feedback on this article? Concerned about the content? Get in touch with us directly. Alternatively, email editorial-team (at) simplywallst.com.This article by Simply Wall St is general in nature. We provide commentary based on historical data and analyst forecasts only using an unbiased methodology and our articles are not intended to be financial advice. It does not constitute a recommendation to buy or sell any stock, and does not take account of your objectives, or your financial situation. We aim to bring you long-term focused analysis driven by fundamental data. Note that our analysis may not factor in the latest price-sensitive company announcements or qualitative material. Simply Wall St has no position in any stocks mentioned.
免責聲明:投資有風險,本文並非投資建議,以上內容不應被視為任何金融產品的購買或出售要約、建議或邀請,作者或其他用戶的任何相關討論、評論或帖子也不應被視為此類內容。本文僅供一般參考,不考慮您的個人投資目標、財務狀況或需求。TTM對信息的準確性和完整性不承擔任何責任或保證,投資者應自行研究並在投資前尋求專業建議。
熱議股票
- 1
- 2
- 3
- 4
- 5
- 6
- 7
- 8
- 9
- 10