China Resources Building Materials Technology Holdings' (HKG:1313) earnings trajectory could turn positive as the stock rises 6.5% this past week
Long term investing works well, but it doesn't always work for each individual stock. We really hate to see fellow investors lose their hard-earned money. For example, we sympathize with anyone who was caught holding China Resources Building Materials Technology Holdings Limited (HKG:1313) during the five years that saw its share price drop a whopping 82%. Contrary to the longer term story, the last month has been good for stockholders, with a share price gain of 9.1%. We really hope anyone holding through that price crash has a diversified portfolio. Even when you lose money, you don't have to lose the lesson.
On a more encouraging note the company has added HK$768m to its market cap in just the last 7 days, so let's see if we can determine what's driven the five-year loss for shareholders.
This technology could replace computers: discover the 20 stocks are working to make quantum computing a reality.
There is no denying that markets are sometimes efficient, but prices do not always reflect underlying business performance. One imperfect but simple way to consider how the market perception of a company has shifted is to compare the change in the earnings per share (EPS) with the share price movement.
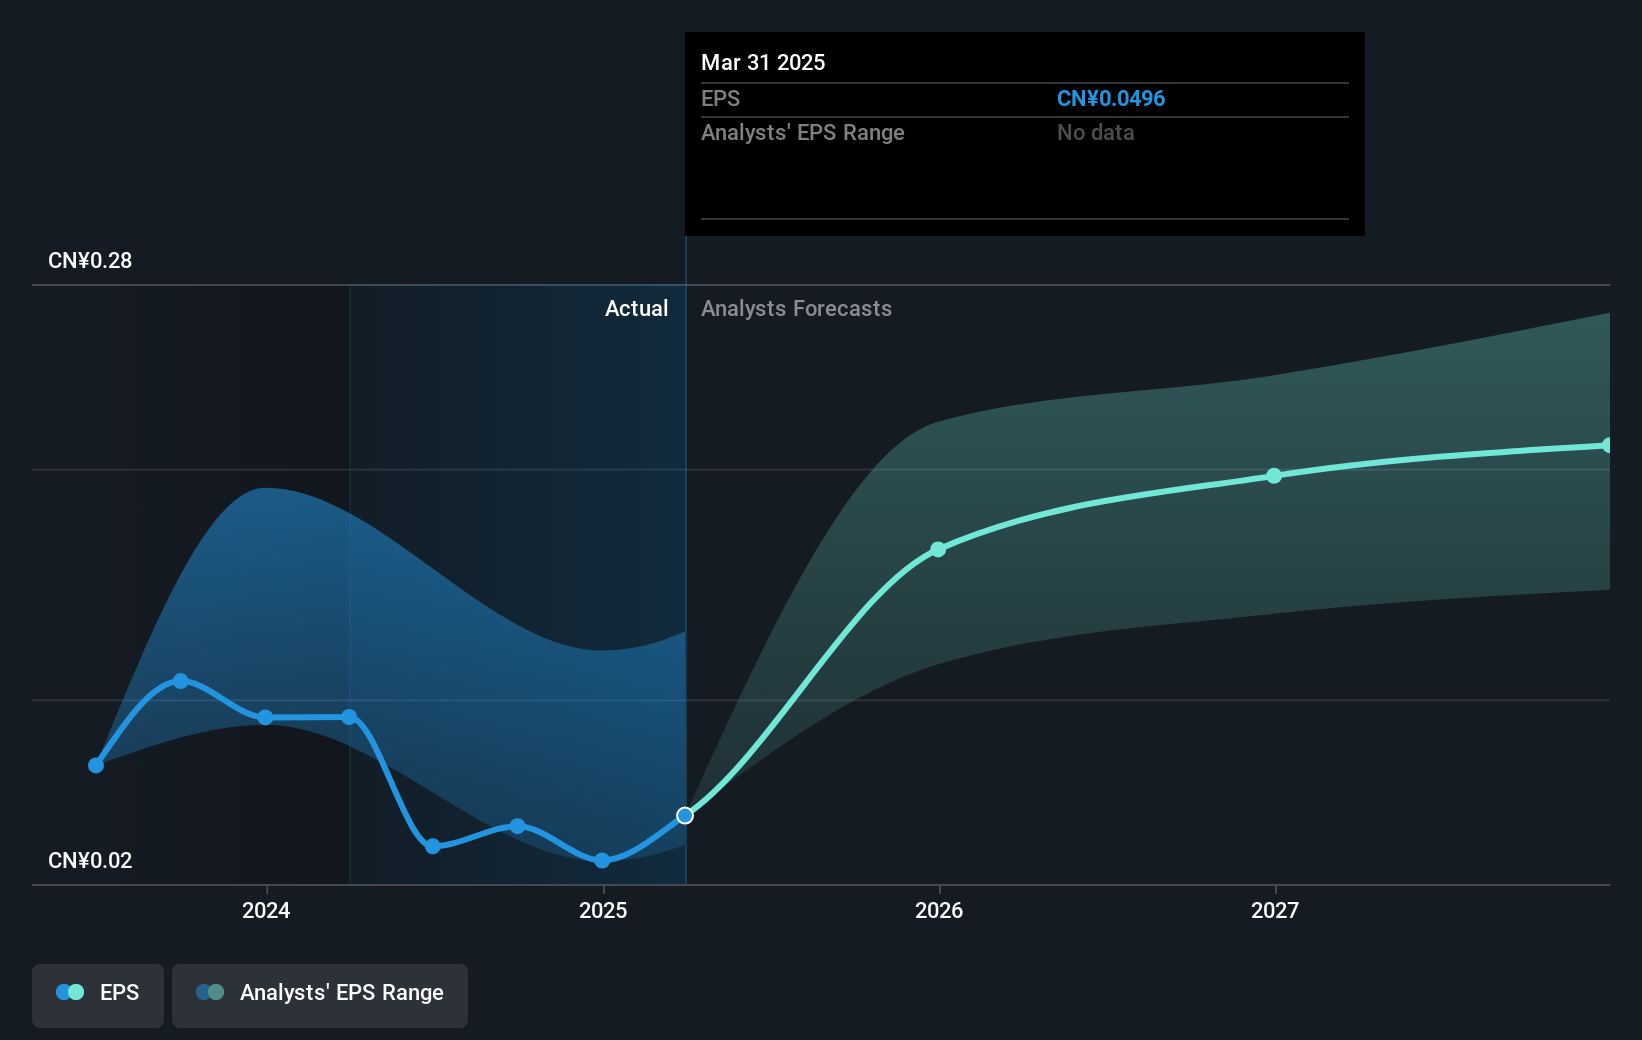
During the five years over which the share price declined, China Resources Building Materials Technology Holdings' earnings per share (EPS) dropped by 46% each year. This fall in the EPS is worse than the 29% compound annual share price fall. The relatively muted share price reaction might be because the market expects the business to turn around.
You can see how EPS has changed over time in the image below (click on the chart to see the exact values).
This free interactive report on China Resources Building Materials Technology Holdings' earnings, revenue and cash flow is a great place to start, if you want to investigate the stock further.
What About Dividends?
It is important to consider the total shareholder return, as well as the share price return, for any given stock. The TSR incorporates the value of any spin-offs or discounted capital raisings, along with any dividends, based on the assumption that the dividends are reinvested. Arguably, the TSR gives a more comprehensive picture of the return generated by a stock. We note that for China Resources Building Materials Technology Holdings the TSR over the last 5 years was -78%, which is better than the share price return mentioned above. And there's no prize for guessing that the dividend payments largely explain the divergence!
A Different Perspective
China Resources Building Materials Technology Holdings shareholders are up 8.7% for the year (even including dividends). Unfortunately this falls short of the market return. On the bright side, that's still a gain, and it is certainly better than the yearly loss of about 12% endured over half a decade. So this might be a sign the business has turned its fortunes around. It's always interesting to track share price performance over the longer term. But to understand China Resources Building Materials Technology Holdings better, we need to consider many other factors. For example, we've discovered 1 warning sign for China Resources Building Materials Technology Holdings that you should be aware of before investing here.
Of course China Resources Building Materials Technology Holdings may not be the best stock to buy. So you may wish to see this free collection of growth stocks.
Please note, the market returns quoted in this article reflect the market weighted average returns of stocks that currently trade on Hong Kong exchanges.
New: AI Stock Screener & Alerts
Our new AI Stock Screener scans the market every day to uncover opportunities.
• Dividend Powerhouses (3%+ Yield)• Undervalued Small Caps with Insider Buying• High growth Tech and AI CompaniesOr build your own from over 50 metrics.
Explore Now for FreeHave feedback on this article? Concerned about the content? Get in touch with us directly. Alternatively, email editorial-team (at) simplywallst.com.This article by Simply Wall St is general in nature. We provide commentary based on historical data and analyst forecasts only using an unbiased methodology and our articles are not intended to be financial advice. It does not constitute a recommendation to buy or sell any stock, and does not take account of your objectives, or your financial situation. We aim to bring you long-term focused analysis driven by fundamental data. Note that our analysis may not factor in the latest price-sensitive company announcements or qualitative material. Simply Wall St has no position in any stocks mentioned.
免責聲明:投資有風險,本文並非投資建議,以上內容不應被視為任何金融產品的購買或出售要約、建議或邀請,作者或其他用戶的任何相關討論、評論或帖子也不應被視為此類內容。本文僅供一般參考,不考慮您的個人投資目標、財務狀況或需求。TTM對信息的準確性和完整性不承擔任何責任或保證,投資者應自行研究並在投資前尋求專業建議。
熱議股票
- 1
- 2
- 3
- 4
- 5
- 6
- 7
- 8
- 9
- 10