PS International Group Ltd.'s (NASDAQ:PSIG) 29% Price Boost Is Out Of Tune With Revenues
Those holding PS International Group Ltd. (NASDAQ:PSIG) shares would be relieved that the share price has rebounded 29% in the last thirty days, but it needs to keep going to repair the recent damage it has caused to investor portfolios. Still, the 30-day jump doesn't change the fact that longer term shareholders have seen their stock decimated by the 96% share price drop in the last twelve months.
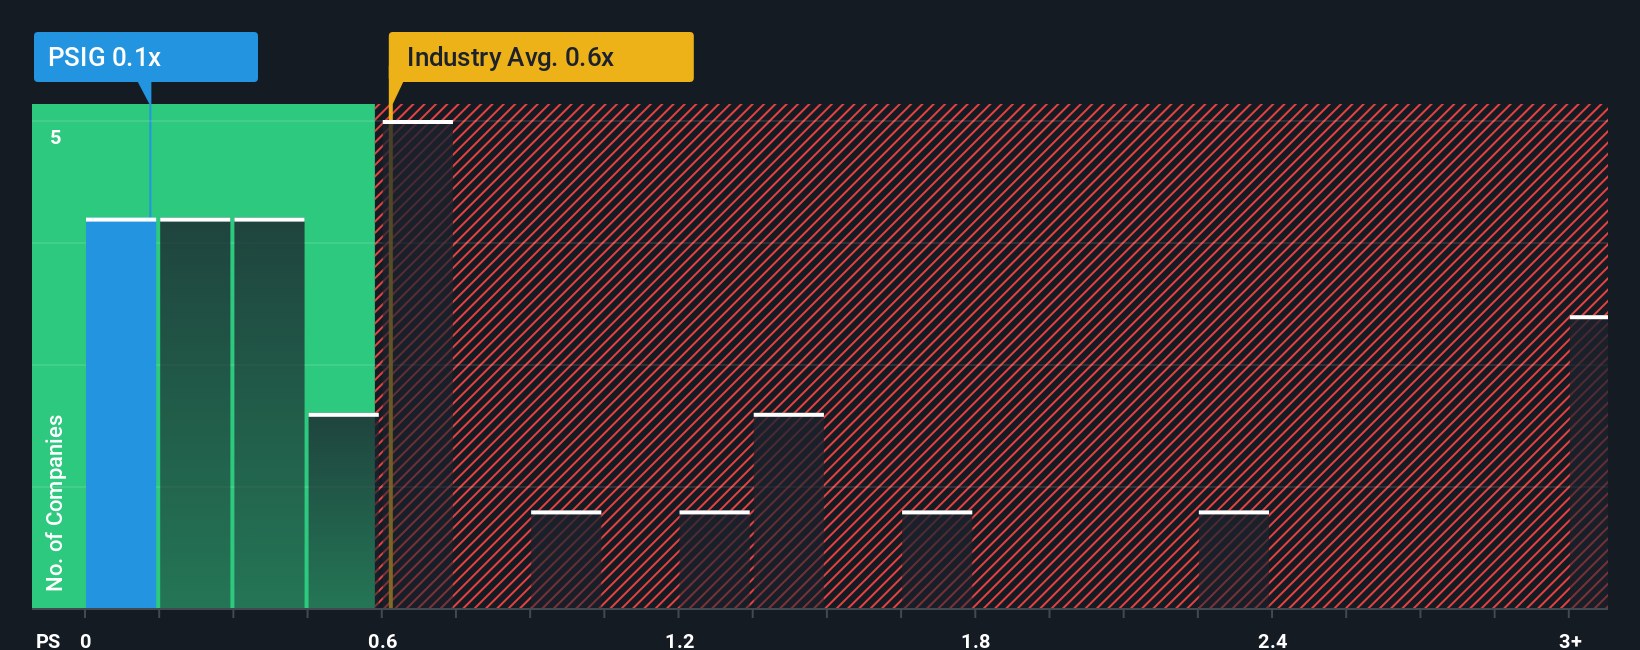
Even after such a large jump in price, there still wouldn't be many who think PS International Group's price-to-sales (or "P/S") ratio of 0.1x is worth a mention when the median P/S in the United States' Logistics industry is similar at about 0.6x. While this might not raise any eyebrows, if the P/S ratio is not justified investors could be missing out on a potential opportunity or ignoring looming disappointment.
AI is about to change healthcare. These 20 stocks are working on everything from early diagnostics to drug discovery. The best part - they are all under $10bn in marketcap - there is still time to get in early.
View our latest analysis for PS International Group
What Does PS International Group's P/S Mean For Shareholders?
For example, consider that PS International Group's financial performance has been poor lately as its revenue has been in decline. It might be that many expect the company to put the disappointing revenue performance behind them over the coming period, which has kept the P/S from falling. If not, then existing shareholders may be a little nervous about the viability of the share price.
Want the full picture on earnings, revenue and cash flow for the company? Then our free report on PS International Group will help you shine a light on its historical performance.How Is PS International Group's Revenue Growth Trending?
In order to justify its P/S ratio, PS International Group would need to produce growth that's similar to the industry.
In reviewing the last year of financials, we were disheartened to see the company's revenues fell to the tune of 38%. As a result, revenue from three years ago have also fallen 33% overall. So unfortunately, we have to acknowledge that the company has not done a great job of growing revenue over that time.
Comparing that to the industry, which is predicted to shrink 0.7% in the next 12 months, the company's downward momentum is still inferior based on recent medium-term annualised revenue results.
In light of this, it's somewhat peculiar that PS International Group's P/S sits in line with the majority of other companies. In general, when revenue shrink rapidly the P/S often shrinks too, which could set up shareholders for future disappointment. Maintaining these prices will be difficult to achieve as a continuation of recent revenue trends is likely to weigh down the shares eventually.
The Final Word
Its shares have lifted substantially and now PS International Group's P/S is back within range of the industry median. We'd say the price-to-sales ratio's power isn't primarily as a valuation instrument but rather to gauge current investor sentiment and future expectations.
Our examination of PS International Group revealed its sharp three-year contraction in revenue isn't impacting its P/S as much as we would have predicted, given the industry is set to shrink less severely. When we see below average revenue, we suspect the share price is at risk of declining, sending the moderate P/S lower. In addition, we would be concerned whether the company can even maintain its medium-term level of performance under these tough industry conditions. This would place shareholders' investments at risk and potential investors in danger of paying an unnecessary premium.
We don't want to rain on the parade too much, but we did also find 4 warning signs for PS International Group (2 can't be ignored!) that you need to be mindful of.
Of course, profitable companies with a history of great earnings growth are generally safer bets. So you may wish to see this free collection of other companies that have reasonable P/E ratios and have grown earnings strongly.
New: Manage All Your Stock Portfolios in One Place
We've created the ultimate portfolio companion for stock investors, and it's free.
• Connect an unlimited number of Portfolios and see your total in one currency• Be alerted to new Warning Signs or Risks via email or mobile• Track the Fair Value of your stocks
Try a Demo Portfolio for FreeHave feedback on this article? Concerned about the content? Get in touch with us directly. Alternatively, email editorial-team (at) simplywallst.com.This article by Simply Wall St is general in nature. We provide commentary based on historical data and analyst forecasts only using an unbiased methodology and our articles are not intended to be financial advice. It does not constitute a recommendation to buy or sell any stock, and does not take account of your objectives, or your financial situation. We aim to bring you long-term focused analysis driven by fundamental data. Note that our analysis may not factor in the latest price-sensitive company announcements or qualitative material. Simply Wall St has no position in any stocks mentioned.
免責聲明:投資有風險,本文並非投資建議,以上內容不應被視為任何金融產品的購買或出售要約、建議或邀請,作者或其他用戶的任何相關討論、評論或帖子也不應被視為此類內容。本文僅供一般參考,不考慮您的個人投資目標、財務狀況或需求。TTM對信息的準確性和完整性不承擔任何責任或保證,投資者應自行研究並在投資前尋求專業建議。
熱議股票
- 1
- 2
- 3
- 4
- 5
- 6
- 7
- 8
- 9
- 10