XMH Holdings Ltd. (SGX:BQF) shareholders have had their patience rewarded with a 36% share price jump in the last month. The last 30 days bring the annual gain to a very sharp 99%.
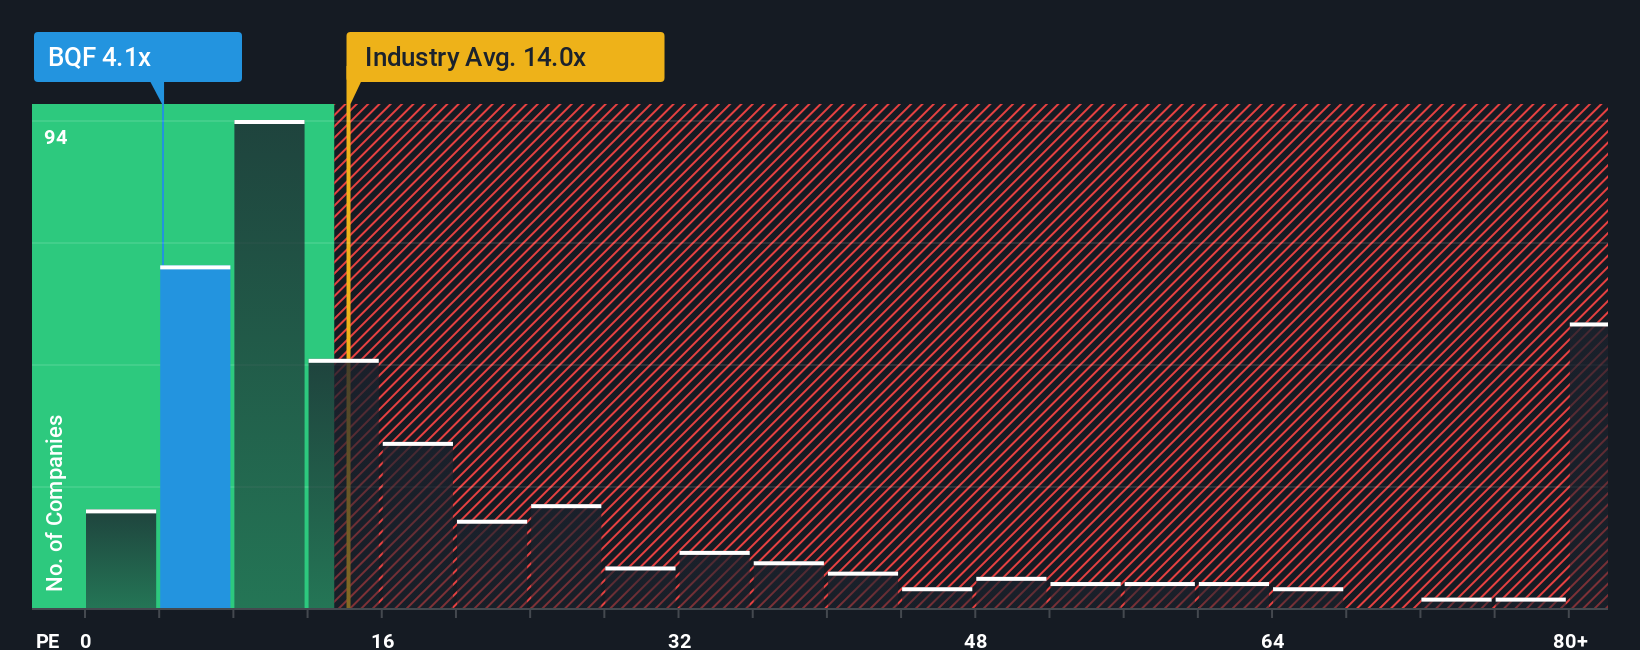
Although its price has surged higher, XMH Holdings' price-to-earnings (or "P/E") ratio of 4.1x might still make it look like a strong buy right now compared to the market in Singapore, where around half of the companies have P/E ratios above 14x and even P/E's above 24x are quite common. Nonetheless, we'd need to dig a little deeper to determine if there is a rational basis for the highly reduced P/E.
AI is about to change healthcare. These 20 stocks are working on everything from early diagnostics to drug discovery. The best part - they are all under $10bn in marketcap - there is still time to get in early.
With earnings growth that's exceedingly strong of late, XMH Holdings has been doing very well. It might be that many expect the strong earnings performance to degrade substantially, which has repressed the P/E. If you like the company, you'd be hoping this isn't the case so that you could potentially pick up some stock while it's out of favour.
See our latest analysis for XMH Holdings
What Are Growth Metrics Telling Us About The Low P/E?
XMH Holdings' P/E ratio would be typical for a company that's expected to deliver very poor growth or even falling earnings, and importantly, perform much worse than the market.
Retrospectively, the last year delivered an exceptional 103% gain to the company's bottom line. The strong recent performance means it was also able to grow EPS by 751% in total over the last three years. So we can start by confirming that the company has done a great job of growing earnings over that time.
Comparing that to the market, which is only predicted to deliver 12% growth in the next 12 months, the company's momentum is stronger based on recent medium-term annualised earnings results.
In light of this, it's peculiar that XMH Holdings' P/E sits below the majority of other companies. Apparently some shareholders believe the recent performance has exceeded its limits and have been accepting significantly lower selling prices.
The Bottom Line On XMH Holdings' P/E
Shares in XMH Holdings are going to need a lot more upward momentum to get the company's P/E out of its slump. Typically, we'd caution against reading too much into price-to-earnings ratios when settling on investment decisions, though it can reveal plenty about what other market participants think about the company.
We've established that XMH Holdings currently trades on a much lower than expected P/E since its recent three-year growth is higher than the wider market forecast. When we see strong earnings with faster-than-market growth, we assume potential risks are what might be placing significant pressure on the P/E ratio. At least price risks look to be very low if recent medium-term earnings trends continue, but investors seem to think future earnings could see a lot of volatility.
Before you settle on your opinion, we've discovered 4 warning signs for XMH Holdings (2 make us uncomfortable!) that you should be aware of.
Of course, you might also be able to find a better stock than XMH Holdings. So you may wish to see this free collection of other companies that have reasonable P/E ratios and have grown earnings strongly.
New: AI Stock Screener & Alerts
Our new AI Stock Screener scans the market every day to uncover opportunities.
• Dividend Powerhouses (3%+ Yield)• Undervalued Small Caps with Insider Buying• High growth Tech and AI CompaniesOr build your own from over 50 metrics.
Explore Now for FreeHave feedback on this article? Concerned about the content? Get in touch with us directly. Alternatively, email editorial-team (at) simplywallst.com.This article by Simply Wall St is general in nature. We provide commentary based on historical data and analyst forecasts only using an unbiased methodology and our articles are not intended to be financial advice. It does not constitute a recommendation to buy or sell any stock, and does not take account of your objectives, or your financial situation. We aim to bring you long-term focused analysis driven by fundamental data. Note that our analysis may not factor in the latest price-sensitive company announcements or qualitative material. Simply Wall St has no position in any stocks mentioned.