Dynavax Technologies (NASDAQ:DVAX) shareholders are up 5.3% this past week, but still in the red over the last three years
Many investors define successful investing as beating the market average over the long term. But if you try your hand at stock picking, you risk returning less than the market. We regret to report that long term Dynavax Technologies Corporation (NASDAQ:DVAX) shareholders have had that experience, with the share price dropping 27% in three years, versus a market return of about 69%. Furthermore, it's down 12% in about a quarter. That's not much fun for holders.
Although the past week has been more reassuring for shareholders, they're still in the red over the last three years, so let's see if the underlying business has been responsible for the decline.
AI is about to change healthcare. These 20 stocks are working on everything from early diagnostics to drug discovery. The best part - they are all under $10bn in marketcap - there is still time to get in early.
While markets are a powerful pricing mechanism, share prices reflect investor sentiment, not just underlying business performance. One way to examine how market sentiment has changed over time is to look at the interaction between a company's share price and its earnings per share (EPS).
Dynavax Technologies saw its share price decline over the three years in which its EPS also dropped, falling to a loss. Extraordinary items contributed to this situation. Due to the loss, it's not easy to use EPS as a reliable guide to the business. However, we can say we'd expect to see a falling share price in this scenario.
The image below shows how EPS has tracked over time (if you click on the image you can see greater detail).
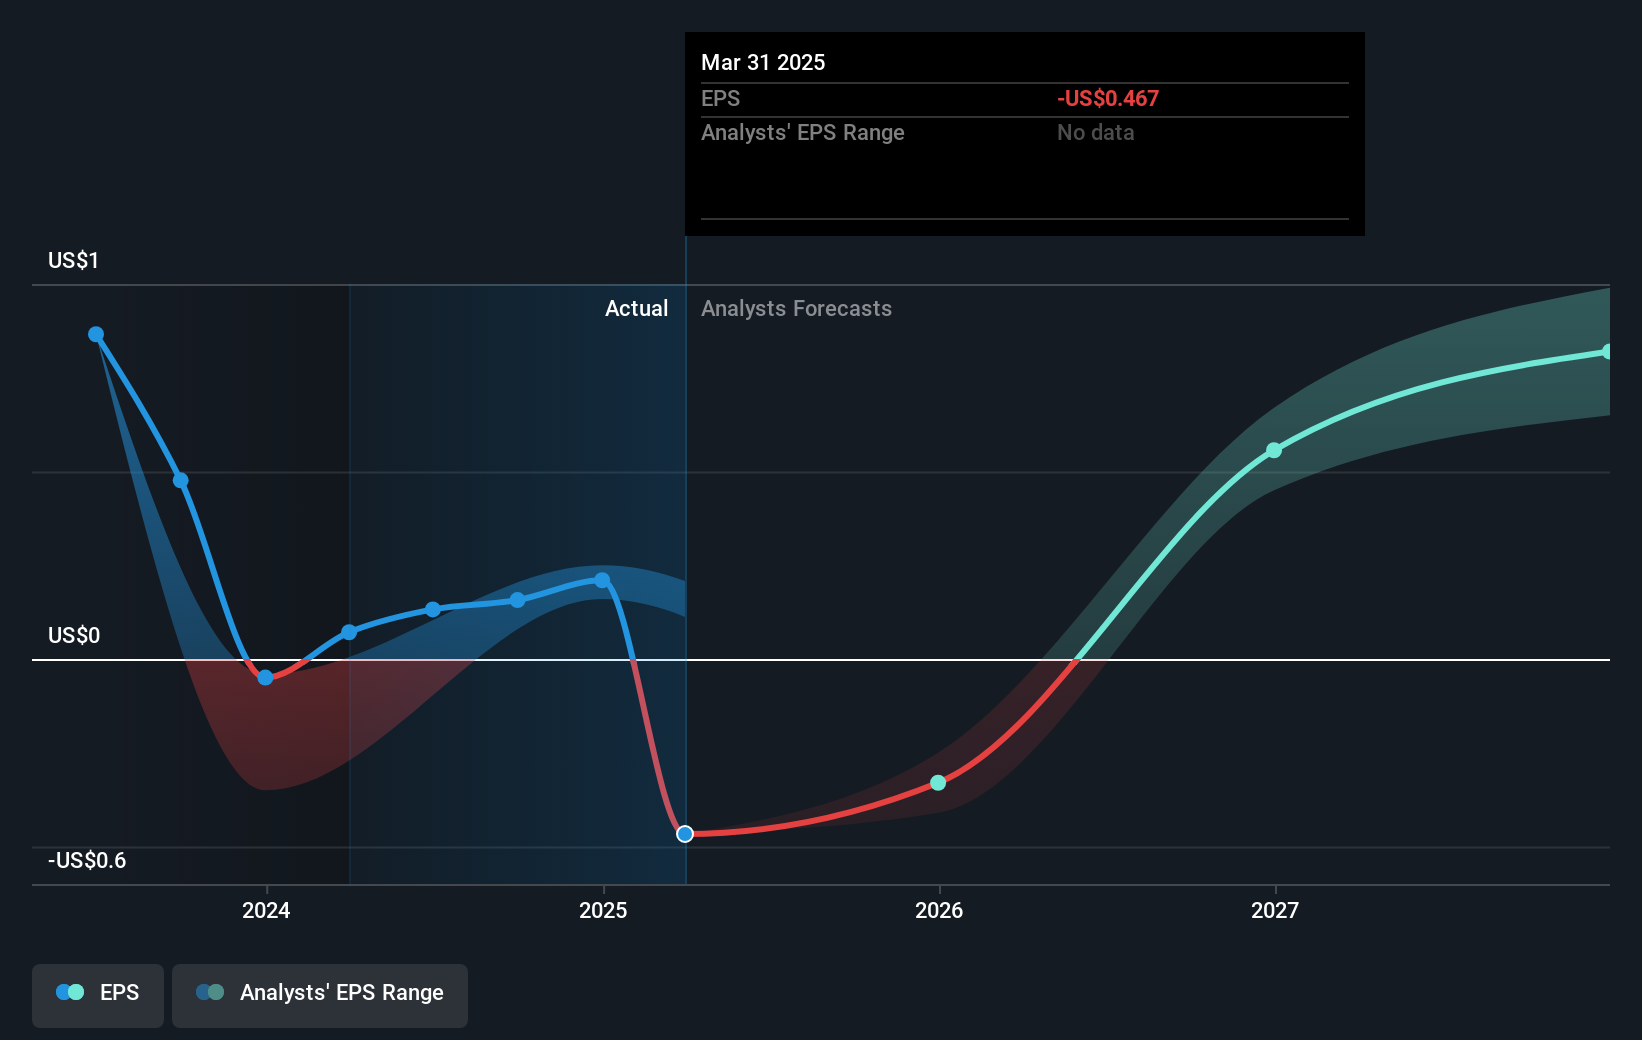
Dive deeper into Dynavax Technologies' key metrics by checking this interactive graph of Dynavax Technologies's earnings, revenue and cash flow.
A Different Perspective
Dynavax Technologies shareholders are down 3.6% for the year, but the market itself is up 14%. However, keep in mind that even the best stocks will sometimes underperform the market over a twelve month period. Longer term investors wouldn't be so upset, since they would have made 3%, each year, over five years. If the fundamental data continues to indicate long term sustainable growth, the current sell-off could be an opportunity worth considering. Shareholders might want to examine this detailed historical graph of past earnings, revenue and cash flow.
If you like to buy stocks alongside management, then you might just love this free list of companies. (Hint: many of them are unnoticed AND have attractive valuation).
Please note, the market returns quoted in this article reflect the market weighted average returns of stocks that currently trade on American exchanges.
New: Manage All Your Stock Portfolios in One Place
We've created the ultimate portfolio companion for stock investors, and it's free.
• Connect an unlimited number of Portfolios and see your total in one currency• Be alerted to new Warning Signs or Risks via email or mobile• Track the Fair Value of your stocks
Try a Demo Portfolio for FreeHave feedback on this article? Concerned about the content? Get in touch with us directly. Alternatively, email editorial-team (at) simplywallst.com.This article by Simply Wall St is general in nature. We provide commentary based on historical data and analyst forecasts only using an unbiased methodology and our articles are not intended to be financial advice. It does not constitute a recommendation to buy or sell any stock, and does not take account of your objectives, or your financial situation. We aim to bring you long-term focused analysis driven by fundamental data. Note that our analysis may not factor in the latest price-sensitive company announcements or qualitative material. Simply Wall St has no position in any stocks mentioned.
免責聲明:投資有風險,本文並非投資建議,以上內容不應被視為任何金融產品的購買或出售要約、建議或邀請,作者或其他用戶的任何相關討論、評論或帖子也不應被視為此類內容。本文僅供一般參考,不考慮您的個人投資目標、財務狀況或需求。TTM對信息的準確性和完整性不承擔任何責任或保證,投資者應自行研究並在投資前尋求專業建議。
熱議股票
- 1
- 2
- 3
- 4
- 5
- 6
- 7
- 8
- 9
- 10