Investors Appear Satisfied With JF SmartInvest Holdings Ltd's (HKG:9636) Prospects As Shares Rocket 27%
JF SmartInvest Holdings Ltd (HKG:9636) shares have continued their recent momentum with a 27% gain in the last month alone. This latest share price bounce rounds out a remarkable 451% gain over the last twelve months.
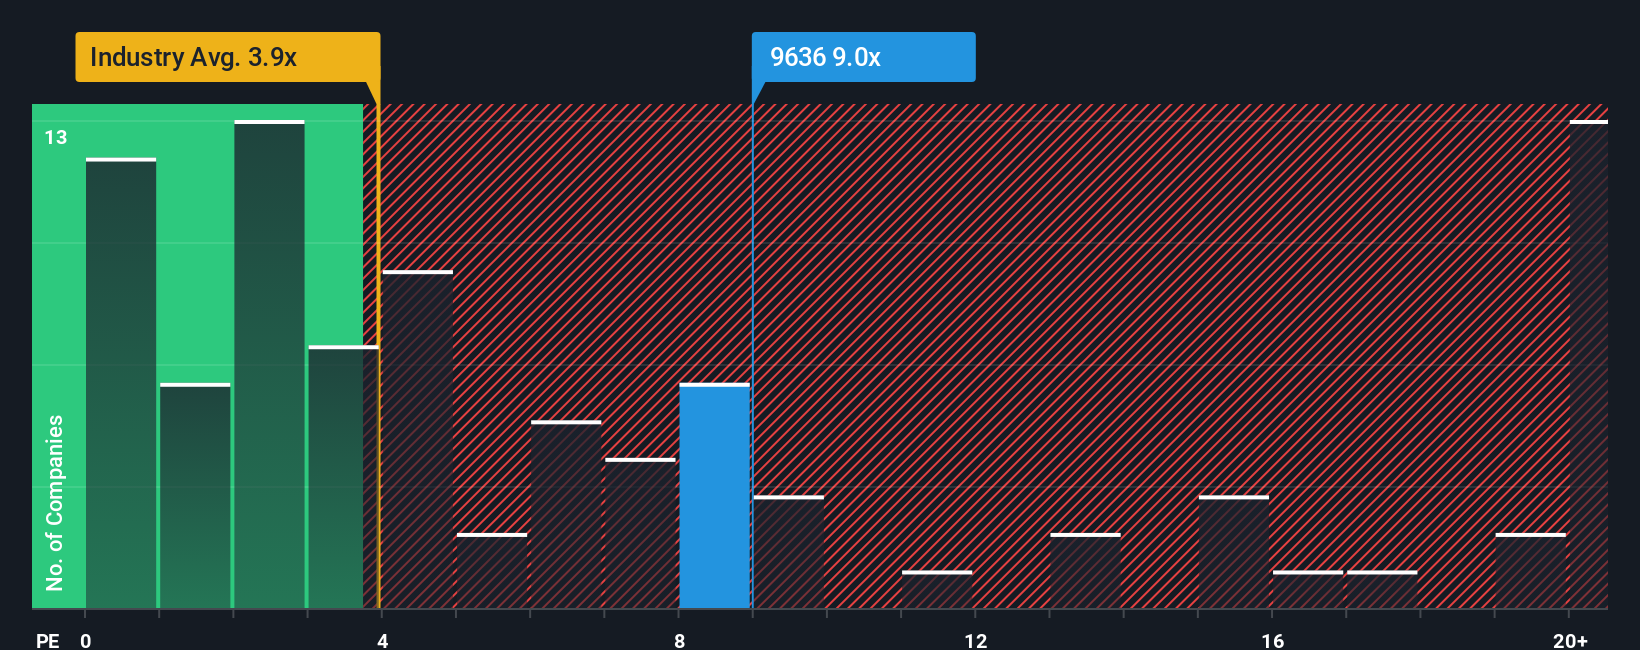
Since its price has surged higher, you could be forgiven for thinking JF SmartInvest Holdings is a stock to steer clear of with a price-to-sales ratios (or "P/S") of 9x, considering almost half the companies in Hong Kong's Capital Markets industry have P/S ratios below 3.9x. Although, it's not wise to just take the P/S at face value as there may be an explanation why it's so lofty.
AI is about to change healthcare. These 20 stocks are working on everything from early diagnostics to drug discovery. The best part - they are all under $10bn in marketcap - there is still time to get in early.
See our latest analysis for JF SmartInvest Holdings
What Does JF SmartInvest Holdings' Recent Performance Look Like?
Recent times haven't been great for JF SmartInvest Holdings as its revenue has been rising slower than most other companies. Perhaps the market is expecting future revenue performance to undergo a reversal of fortunes, which has elevated the P/S ratio. If not, then existing shareholders may be very nervous about the viability of the share price.
Want the full picture on analyst estimates for the company? Then our free report on JF SmartInvest Holdings will help you uncover what's on the horizon.How Is JF SmartInvest Holdings' Revenue Growth Trending?
The only time you'd be truly comfortable seeing a P/S as steep as JF SmartInvest Holdings' is when the company's growth is on track to outshine the industry decidedly.
Retrospectively, the last year delivered an exceptional 17% gain to the company's top line. The strong recent performance means it was also able to grow revenue by 59% in total over the last three years. So we can start by confirming that the company has done a great job of growing revenue over that time.
Shifting to the future, estimates from the two analysts covering the company suggest revenue should grow by 59% over the next year. Meanwhile, the rest of the industry is forecast to only expand by 41%, which is noticeably less attractive.
With this in mind, it's not hard to understand why JF SmartInvest Holdings' P/S is high relative to its industry peers. It seems most investors are expecting this strong future growth and are willing to pay more for the stock.
What We Can Learn From JF SmartInvest Holdings' P/S?
Shares in JF SmartInvest Holdings have seen a strong upwards swing lately, which has really helped boost its P/S figure. We'd say the price-to-sales ratio's power isn't primarily as a valuation instrument but rather to gauge current investor sentiment and future expectations.
We've established that JF SmartInvest Holdings maintains its high P/S on the strength of its forecasted revenue growth being higher than the the rest of the Capital Markets industry, as expected. It appears that shareholders are confident in the company's future revenues, which is propping up the P/S. It's hard to see the share price falling strongly in the near future under these circumstances.
The company's balance sheet is another key area for risk analysis. You can assess many of the main risks through our free balance sheet analysis for JF SmartInvest Holdings with six simple checks.
Of course, profitable companies with a history of great earnings growth are generally safer bets. So you may wish to see this free collection of other companies that have reasonable P/E ratios and have grown earnings strongly.
New: Manage All Your Stock Portfolios in One Place
We've created the ultimate portfolio companion for stock investors, and it's free.
• Connect an unlimited number of Portfolios and see your total in one currency• Be alerted to new Warning Signs or Risks via email or mobile• Track the Fair Value of your stocks
Try a Demo Portfolio for FreeHave feedback on this article? Concerned about the content? Get in touch with us directly. Alternatively, email editorial-team (at) simplywallst.com.This article by Simply Wall St is general in nature. We provide commentary based on historical data and analyst forecasts only using an unbiased methodology and our articles are not intended to be financial advice. It does not constitute a recommendation to buy or sell any stock, and does not take account of your objectives, or your financial situation. We aim to bring you long-term focused analysis driven by fundamental data. Note that our analysis may not factor in the latest price-sensitive company announcements or qualitative material. Simply Wall St has no position in any stocks mentioned.
免責聲明:投資有風險,本文並非投資建議,以上內容不應被視為任何金融產品的購買或出售要約、建議或邀請,作者或其他用戶的任何相關討論、評論或帖子也不應被視為此類內容。本文僅供一般參考,不考慮您的個人投資目標、財務狀況或需求。TTM對信息的準確性和完整性不承擔任何責任或保證,投資者應自行研究並在投資前尋求專業建議。
熱議股票
- 1
- 2
- 3
- 4
- 5
- 6
- 7
- 8
- 9
- 10