Shareholders 41% loss in Pengana Capital Group (ASX:PCG) partly attributable to the company's decline in earnings over past three years
While it may not be enough for some shareholders, we think it is good to see the Pengana Capital Group Limited (ASX:PCG) share price up 28% in a single quarter. But that cannot eclipse the less-than-impressive returns over the last three years. Truth be told the share price declined 48% in three years and that return, Dear Reader, falls short of what you could have got from passive investing with an index fund.
On a more encouraging note the company has added AU$11m to its market cap in just the last 7 days, so let's see if we can determine what's driven the three-year loss for shareholders.
Trump has pledged to "unleash" American oil and gas and these 15 US stocks have developments that are poised to benefit.
We don't think that Pengana Capital Group's modest trailing twelve month profit has the market's full attention at the moment. We think revenue is probably a better guide. As a general rule, we think this kind of company is more comparable to loss-making stocks, since the actual profit is so low. For shareholders to have confidence a company will grow profits significantly, it must grow revenue.
Over the last three years, Pengana Capital Group's revenue dropped 24% per year. That's definitely a weaker result than most pre-profit companies report. With revenue in decline, the share price decline of 14% per year is hardly undeserved. It would probably be worth asking whether the company can fund itself to profitability. The company will need to return to revenue growth as quickly as possible, if it wants to see some enthusiasm from investors.
The graphic below depicts how earnings and revenue have changed over time (unveil the exact values by clicking on the image).
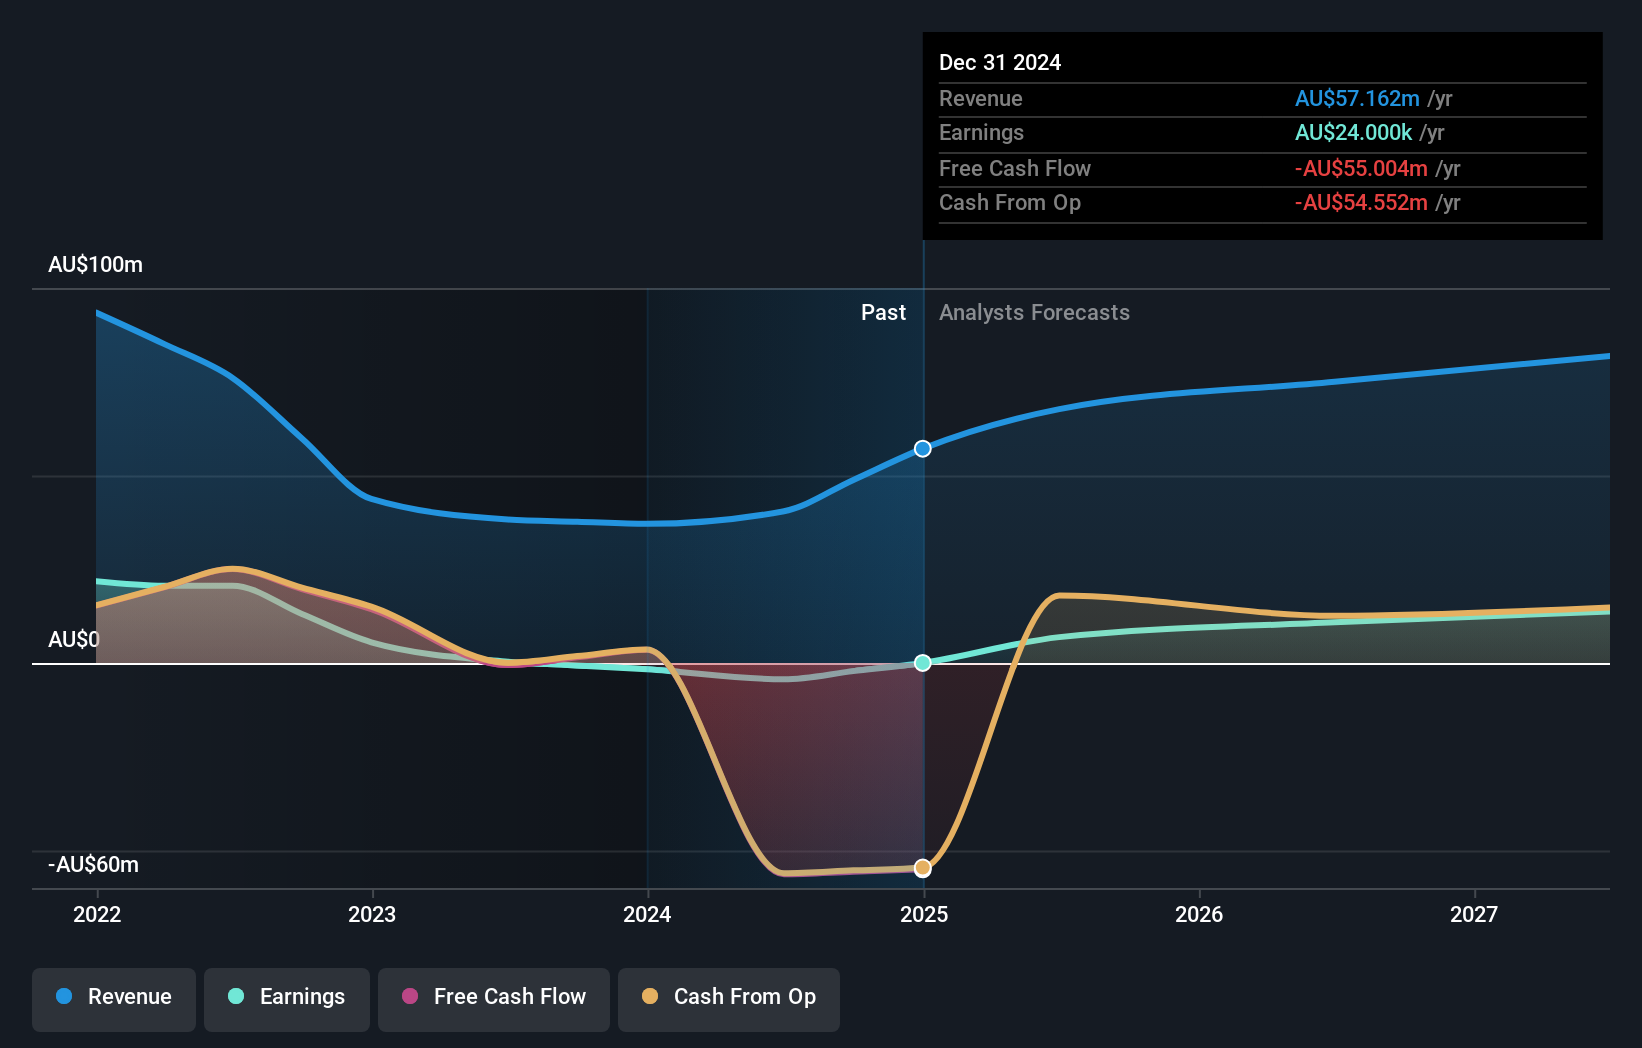
We know that Pengana Capital Group has improved its bottom line lately, but what does the future have in store? You can see what analysts are predicting for Pengana Capital Group in this interactive graph of future profit estimates.
What About Dividends?
As well as measuring the share price return, investors should also consider the total shareholder return (TSR). The TSR incorporates the value of any spin-offs or discounted capital raisings, along with any dividends, based on the assumption that the dividends are reinvested. It's fair to say that the TSR gives a more complete picture for stocks that pay a dividend. In the case of Pengana Capital Group, it has a TSR of -41% for the last 3 years. That exceeds its share price return that we previously mentioned. This is largely a result of its dividend payments!
A Different Perspective
Pengana Capital Group shareholders are down 3.9% for the year (even including dividends), but the market itself is up 10%. However, keep in mind that even the best stocks will sometimes underperform the market over a twelve month period. Longer term investors wouldn't be so upset, since they would have made 2%, each year, over five years. If the fundamental data continues to indicate long term sustainable growth, the current sell-off could be an opportunity worth considering. I find it very interesting to look at share price over the long term as a proxy for business performance. But to truly gain insight, we need to consider other information, too. Like risks, for instance. Every company has them, and we've spotted 3 warning signs for Pengana Capital Group (of which 2 are significant!) you should know about.
We will like Pengana Capital Group better if we see some big insider buys. While we wait, check out this free list of undervalued stocks (mostly small caps) with considerable, recent, insider buying.
Please note, the market returns quoted in this article reflect the market weighted average returns of stocks that currently trade on Australian exchanges.
New: Manage All Your Stock Portfolios in One Place
We've created the ultimate portfolio companion for stock investors, and it's free.
• Connect an unlimited number of Portfolios and see your total in one currency• Be alerted to new Warning Signs or Risks via email or mobile• Track the Fair Value of your stocks
Try a Demo Portfolio for FreeHave feedback on this article? Concerned about the content? Get in touch with us directly. Alternatively, email editorial-team (at) simplywallst.com.This article by Simply Wall St is general in nature. We provide commentary based on historical data and analyst forecasts only using an unbiased methodology and our articles are not intended to be financial advice. It does not constitute a recommendation to buy or sell any stock, and does not take account of your objectives, or your financial situation. We aim to bring you long-term focused analysis driven by fundamental data. Note that our analysis may not factor in the latest price-sensitive company announcements or qualitative material. Simply Wall St has no position in any stocks mentioned.
免責聲明:投資有風險,本文並非投資建議,以上內容不應被視為任何金融產品的購買或出售要約、建議或邀請,作者或其他用戶的任何相關討論、評論或帖子也不應被視為此類內容。本文僅供一般參考,不考慮您的個人投資目標、財務狀況或需求。TTM對信息的準確性和完整性不承擔任何責任或保證,投資者應自行研究並在投資前尋求專業建議。
熱議股票
- 1
- 2
- 3
- 4
- 5
- 6
- 7
- 8
- 9
- 10