Deep Yellow Leads The Charge On ASX With 2 Other Penny Stocks
The Australian market is poised for a cautious start, with shares expected to open 0.7% lower as traders react to rising U.S. consumer prices and potential impacts from global economic policies. In such fluctuating conditions, investors often look for opportunities that balance affordability with growth potential, making penny stocks an intriguing option despite their somewhat outdated label. These stocks typically represent smaller or newer companies and can offer significant upside when supported by strong financials and solid business fundamentals.
Top 10 Penny Stocks In Australia
| Name | Share Price | Market Cap | Rewards & Risks |
| Alfabs Australia (ASX:AAL) | A$0.38 | A$108.9M | ✅ 3 ⚠️ 3 View Analysis > |
| EZZ Life Science Holdings (ASX:EZZ) | A$2.17 | A$102.37M | ✅ 4 ⚠️ 3 View Analysis > |
| GTN (ASX:GTN) | A$0.61 | A$116.31M | ✅ 3 ⚠️ 2 View Analysis > |
| IVE Group (ASX:IGL) | A$3.01 | A$464.09M | ✅ 4 ⚠️ 2 View Analysis > |
| West African Resources (ASX:WAF) | A$2.39 | A$2.72B | ✅ 5 ⚠️ 1 View Analysis > |
| Southern Cross Electrical Engineering (ASX:SXE) | A$1.75 | A$462.72M | ✅ 4 ⚠️ 1 View Analysis > |
| Regal Partners (ASX:RPL) | A$2.62 | A$880.91M | ✅ 4 ⚠️ 2 View Analysis > |
| Sugar Terminals (NSX:SUG) | A$0.99 | A$360M | ✅ 2 ⚠️ 2 View Analysis > |
| Navigator Global Investments (ASX:NGI) | A$1.70 | A$833.14M | ✅ 5 ⚠️ 3 View Analysis > |
| CTI Logistics (ASX:CLX) | A$1.84 | A$148.2M | ✅ 4 ⚠️ 2 View Analysis > |
Click here to see the full list of 458 stocks from our ASX Penny Stocks screener.
Let's dive into some prime choices out of the screener.
Deep Yellow (ASX:DYL)
Simply Wall St Financial Health Rating: ★★★★★☆
Overview: Deep Yellow Limited is a uranium exploration company operating in Namibia and Australia, with a market cap of A$1.72 billion.
Operations: Deep Yellow Limited does not have any reported revenue segments.
Market Cap: A$1.72B
Deep Yellow Limited, with a market cap of A$1.72 billion, is a pre-revenue uranium exploration company operating in Namibia and Australia. Despite being unprofitable and having earnings forecasted to decline by an average of 37.7% annually over the next three years, it trades at 79.8% below its estimated fair value. The company maintains a robust financial position with A$246.1 million in short-term assets covering both short and long-term liabilities, while being debt-free for the past five years. Additionally, Deep Yellow has sufficient cash runway for more than three years based on current free cash flow levels without significant shareholder dilution recently noted.
- Dive into the specifics of Deep Yellow here with our thorough balance sheet health report.
- Gain insights into Deep Yellow's future direction by reviewing our growth report.
IPD Group (ASX:IPG)
Simply Wall St Financial Health Rating: ★★★★★☆
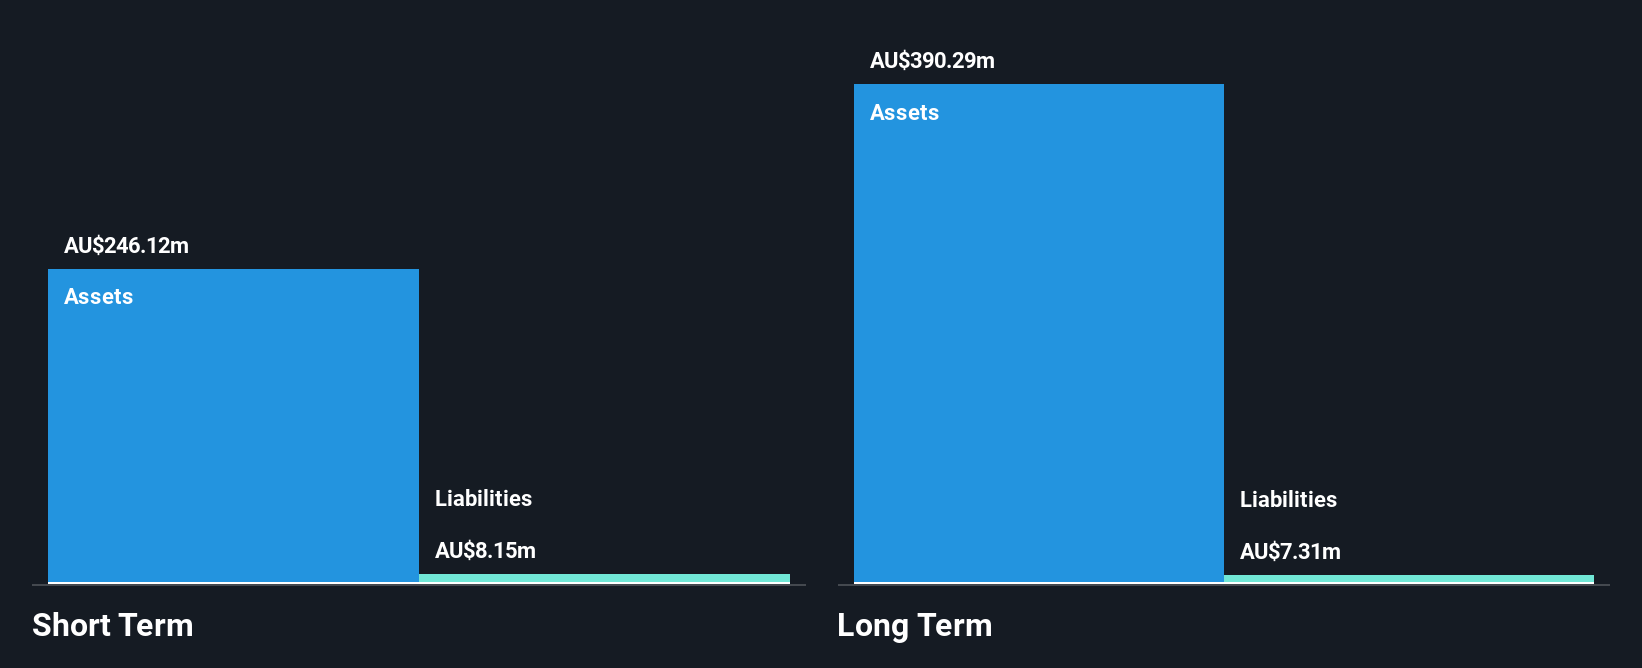
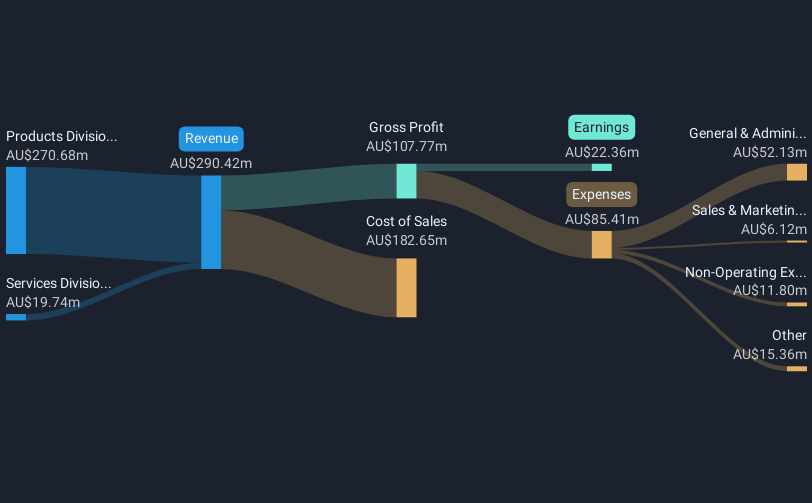
Overview: IPD Group Limited is an Australian company that distributes electrical infrastructure, with a market cap of A$368.11 million.
Operations: The company generates revenue through its Products Division, contributing A$325.32 million, and its Services Division, which brings in A$21.30 million.
Market Cap: A$368.11M
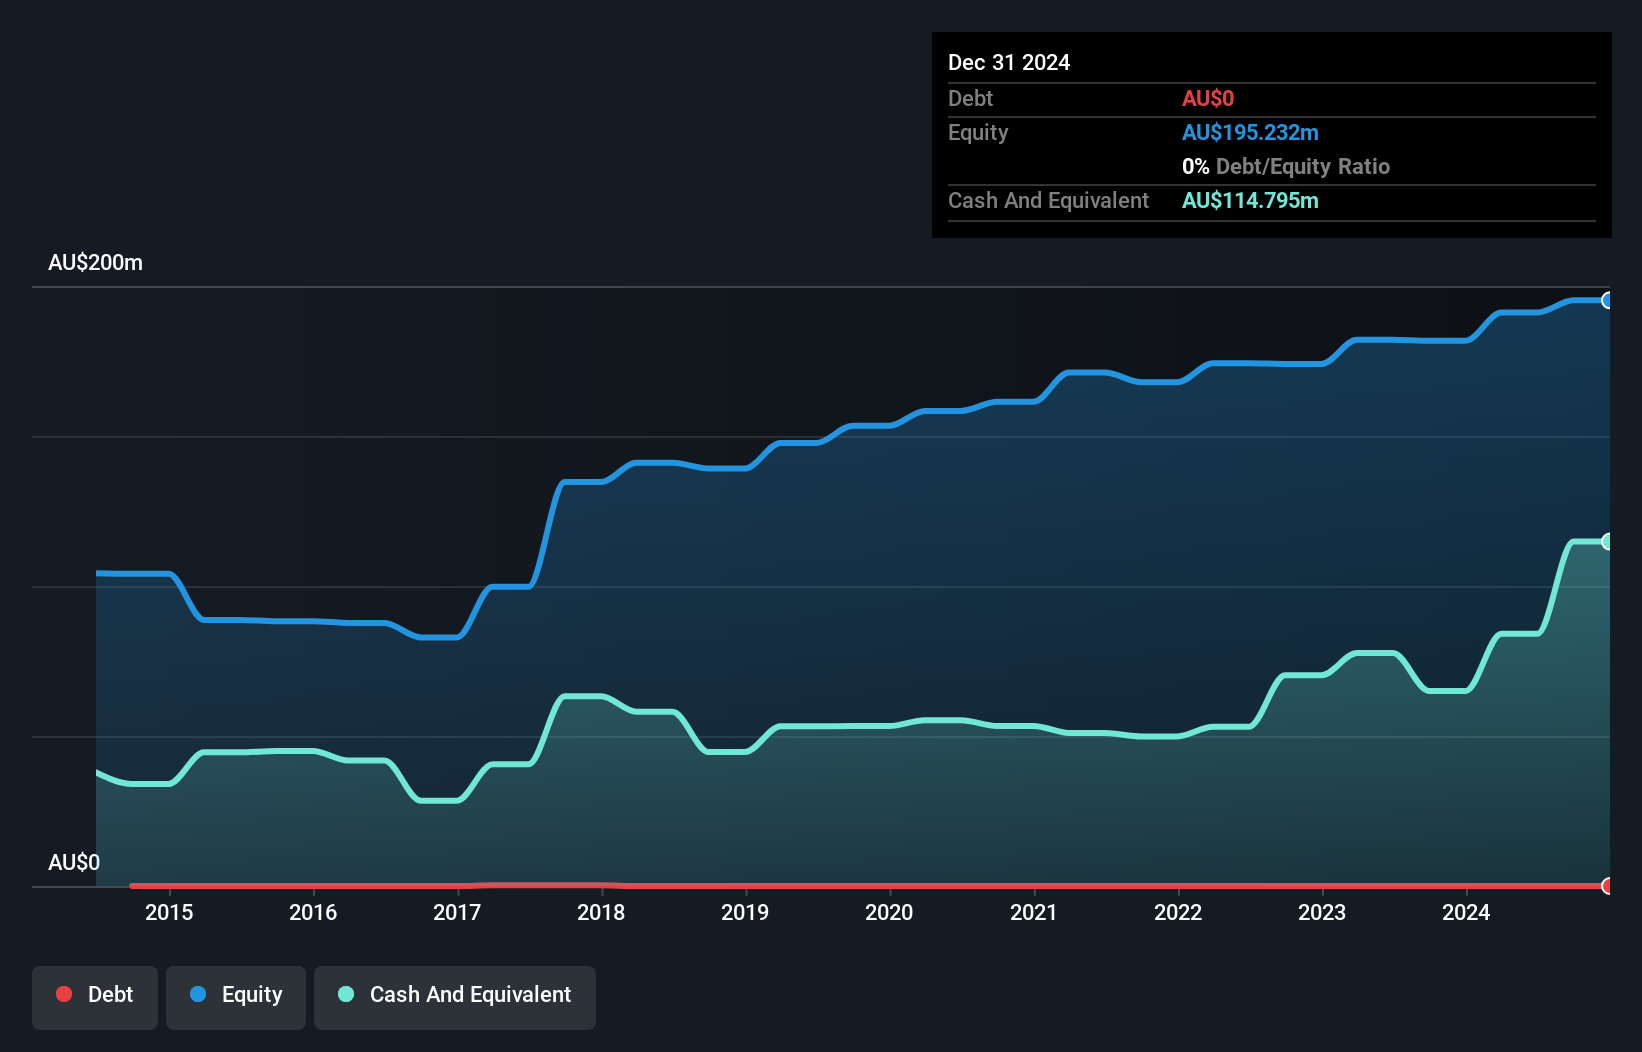
IPD Group Limited, with a market cap of A$368.11 million, demonstrates solid financial health and growth potential in the penny stock landscape. The company has shown impressive earnings growth of 48.7% over the past year, surpassing industry averages. Its net profit margin slightly improved to 7.5%, and its debt is well covered by operating cash flow at 125%. IPD's short-term assets comfortably cover both short-term (A$71.9M) and long-term liabilities (A$47.3M). Furthermore, the management team is experienced with an average tenure of 2.5 years, contributing to stable operations amidst low weekly volatility of 6%.
- Click to explore a detailed breakdown of our findings in IPD Group's financial health report.
- Examine IPD Group's earnings growth report to understand how analysts expect it to perform.
Southern Cross Electrical Engineering (ASX:SXE)
Simply Wall St Financial Health Rating: ★★★★★★
Overview: Southern Cross Electrical Engineering Limited offers electrical, instrumentation, communications, security, and maintenance services to the resources, commercial, and infrastructure sectors in Australia with a market cap of A$462.72 million.
Operations: The company generates revenue of A$693.73 million from its electrical services segment.
Market Cap: A$462.72M
Southern Cross Electrical Engineering Limited, with a market cap of A$462.72 million, presents a stable financial profile in the penny stock segment. The company is debt-free, mitigating interest payment concerns and enhancing its financial flexibility. With earnings growth of 42.3% over the past year, it surpasses both its historical average and industry benchmarks. Despite slightly declining net profit margins from 4.3% to 4.1%, short-term assets (A$240.7M) exceed liabilities comfortably, supporting liquidity strength. Its experienced management team and board contribute to steady operations while trading at a discount to estimated fair value suggests potential upside according to analysts' consensus estimates.
- Get an in-depth perspective on Southern Cross Electrical Engineering's performance by reading our balance sheet health report here.
- Gain insights into Southern Cross Electrical Engineering's outlook and expected performance with our report on the company's earnings estimates.
Key Takeaways
- Navigate through the entire inventory of 458 ASX Penny Stocks here.
- Looking For Alternative Opportunities? We've found 18 US stocks that are forecast to pay a dividend yeild of over 6% next year. See the full list for free.
This article by Simply Wall St is general in nature. We provide commentary based on historical data and analyst forecasts only using an unbiased methodology and our articles are not intended to be financial advice. It does not constitute a recommendation to buy or sell any stock, and does not take account of your objectives, or your financial situation. We aim to bring you long-term focused analysis driven by fundamental data. Note that our analysis may not factor in the latest price-sensitive company announcements or qualitative material. Simply Wall St has no position in any stocks mentioned.
New: Manage All Your Stock Portfolios in One Place
We've created the ultimate portfolio companion for stock investors, and it's free.
• Connect an unlimited number of Portfolios and see your total in one currency• Be alerted to new Warning Signs or Risks via email or mobile• Track the Fair Value of your stocks
Try a Demo Portfolio for FreeHave feedback on this article? Concerned about the content? Get in touch with us directly. Alternatively, email editorial-team@simplywallst.com
免責聲明:投資有風險,本文並非投資建議,以上內容不應被視為任何金融產品的購買或出售要約、建議或邀請,作者或其他用戶的任何相關討論、評論或帖子也不應被視為此類內容。本文僅供一般參考,不考慮您的個人投資目標、財務狀況或需求。TTM對信息的準確性和完整性不承擔任何責任或保證,投資者應自行研究並在投資前尋求專業建議。
熱議股票
- 1
- 2
- 3
- 4
- 5
- 6
- 7
- 8
- 9
- 10