We Think Broadridge Financial Solutions (NYSE:BR) Can Stay On Top Of Its Debt
The external fund manager backed by Berkshire Hathaway's Charlie Munger, Li Lu, makes no bones about it when he says 'The biggest investment risk is not the volatility of prices, but whether you will suffer a permanent loss of capital.' When we think about how risky a company is, we always like to look at its use of debt, since debt overload can lead to ruin. As with many other companies Broadridge Financial Solutions, Inc. (NYSE:BR) makes use of debt. But the more important question is: how much risk is that debt creating?
Trump has pledged to "unleash" American oil and gas and these 15 US stocks have developments that are poised to benefit.
When Is Debt Dangerous?
Debt is a tool to help businesses grow, but if a business is incapable of paying off its lenders, then it exists at their mercy. In the worst case scenario, a company can go bankrupt if it cannot pay its creditors. While that is not too common, we often do see indebted companies permanently diluting shareholders because lenders force them to raise capital at a distressed price. By replacing dilution, though, debt can be an extremely good tool for businesses that need capital to invest in growth at high rates of return. The first thing to do when considering how much debt a business uses is to look at its cash and debt together.
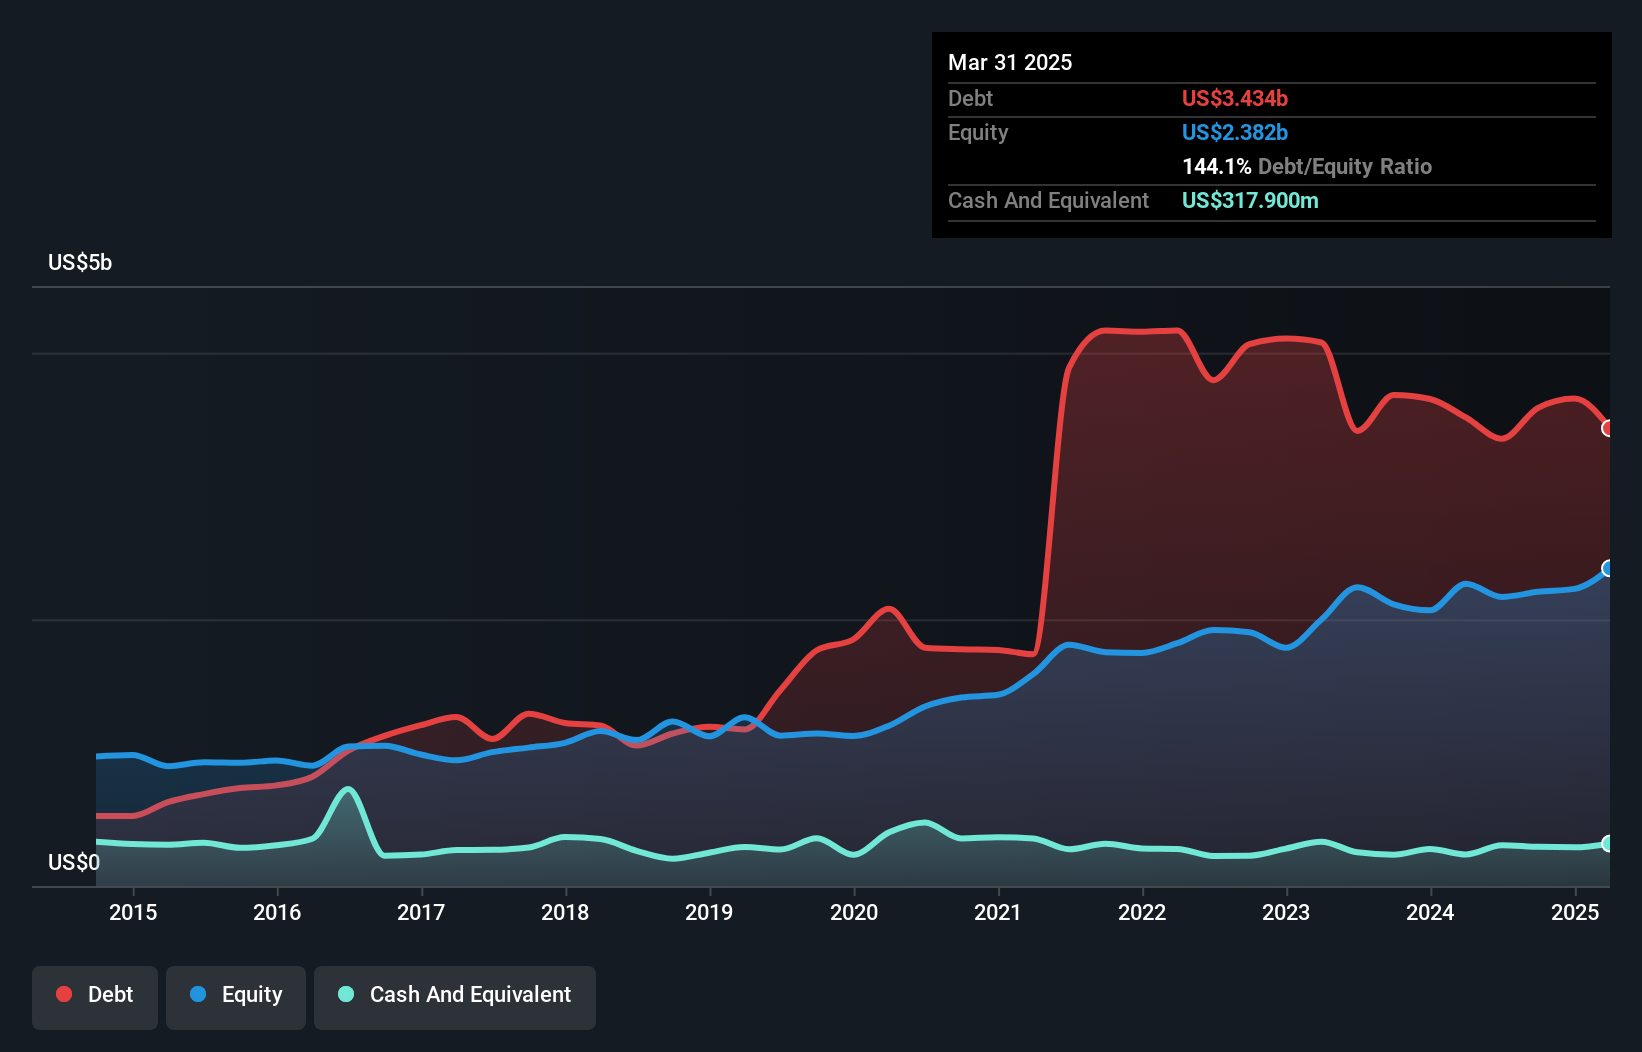
What Is Broadridge Financial Solutions's Net Debt?
As you can see below, Broadridge Financial Solutions had US$3.43b of debt, at March 2025, which is about the same as the year before. You can click the chart for greater detail. However, it does have US$317.9m in cash offsetting this, leading to net debt of about US$3.12b.
A Look At Broadridge Financial Solutions' Liabilities
According to the last reported balance sheet, Broadridge Financial Solutions had liabilities of US$1.26b due within 12 months, and liabilities of US$4.65b due beyond 12 months. On the other hand, it had cash of US$317.9m and US$1.18b worth of receivables due within a year. So it has liabilities totalling US$4.42b more than its cash and near-term receivables, combined.
Since publicly traded Broadridge Financial Solutions shares are worth a very impressive total of US$27.6b, it seems unlikely that this level of liabilities would be a major threat. However, we do think it is worth keeping an eye on its balance sheet strength, as it may change over time.
View our latest analysis for Broadridge Financial Solutions
We use two main ratios to inform us about debt levels relative to earnings. The first is net debt divided by earnings before interest, tax, depreciation, and amortization (EBITDA), while the second is how many times its earnings before interest and tax (EBIT) covers its interest expense (or its interest cover, for short). The advantage of this approach is that we take into account both the absolute quantum of debt (with net debt to EBITDA) and the actual interest expenses associated with that debt (with its interest cover ratio).
With a debt to EBITDA ratio of 1.8, Broadridge Financial Solutions uses debt artfully but responsibly. And the fact that its trailing twelve months of EBIT was 9.2 times its interest expenses harmonizes with that theme. One way Broadridge Financial Solutions could vanquish its debt would be if it stops borrowing more but continues to grow EBIT at around 16%, as it did over the last year. The balance sheet is clearly the area to focus on when you are analysing debt. But it is future earnings, more than anything, that will determine Broadridge Financial Solutions's ability to maintain a healthy balance sheet going forward. So if you want to see what the professionals think, you might find this free report on analyst profit forecasts to be interesting.
Finally, a business needs free cash flow to pay off debt; accounting profits just don't cut it. So the logical step is to look at the proportion of that EBIT that is matched by actual free cash flow. During the last three years, Broadridge Financial Solutions generated free cash flow amounting to a very robust 83% of its EBIT, more than we'd expect. That positions it well to pay down debt if desirable to do so.
Our View
The good news is that Broadridge Financial Solutions's demonstrated ability to convert EBIT to free cash flow delights us like a fluffy puppy does a toddler. And that's just the beginning of the good news since its interest cover is also very heartening. Looking at the bigger picture, we think Broadridge Financial Solutions's use of debt seems quite reasonable and we're not concerned about it. After all, sensible leverage can boost returns on equity. The balance sheet is clearly the area to focus on when you are analysing debt. However, not all investment risk resides within the balance sheet - far from it. We've identified 2 warning signs with Broadridge Financial Solutions , and understanding them should be part of your investment process.
If, after all that, you're more interested in a fast growing company with a rock-solid balance sheet, then check out our list of net cash growth stocks without delay.
Valuation is complex, but we're here to simplify it.
Discover if Broadridge Financial Solutions might be undervalued or overvalued with our detailed analysis, featuring fair value estimates, potential risks, dividends, insider trades, and its financial condition.
Access Free AnalysisHave feedback on this article? Concerned about the content? Get in touch with us directly. Alternatively, email editorial-team (at) simplywallst.com.This article by Simply Wall St is general in nature. We provide commentary based on historical data and analyst forecasts only using an unbiased methodology and our articles are not intended to be financial advice. It does not constitute a recommendation to buy or sell any stock, and does not take account of your objectives, or your financial situation. We aim to bring you long-term focused analysis driven by fundamental data. Note that our analysis may not factor in the latest price-sensitive company announcements or qualitative material. Simply Wall St has no position in any stocks mentioned.
免責聲明:投資有風險,本文並非投資建議,以上內容不應被視為任何金融產品的購買或出售要約、建議或邀請,作者或其他用戶的任何相關討論、評論或帖子也不應被視為此類內容。本文僅供一般參考,不考慮您的個人投資目標、財務狀況或需求。TTM對信息的準確性和完整性不承擔任何責任或保證,投資者應自行研究並在投資前尋求專業建議。
熱議股票
- 1
- 2
- 3
- 4
- 5
- 6
- 7
- 8
- 9
- 10