Is Willdan Group, Inc. (NASDAQ:WLDN) Expensive For A Reason? A Look At Its Intrinsic Value
Key Insights
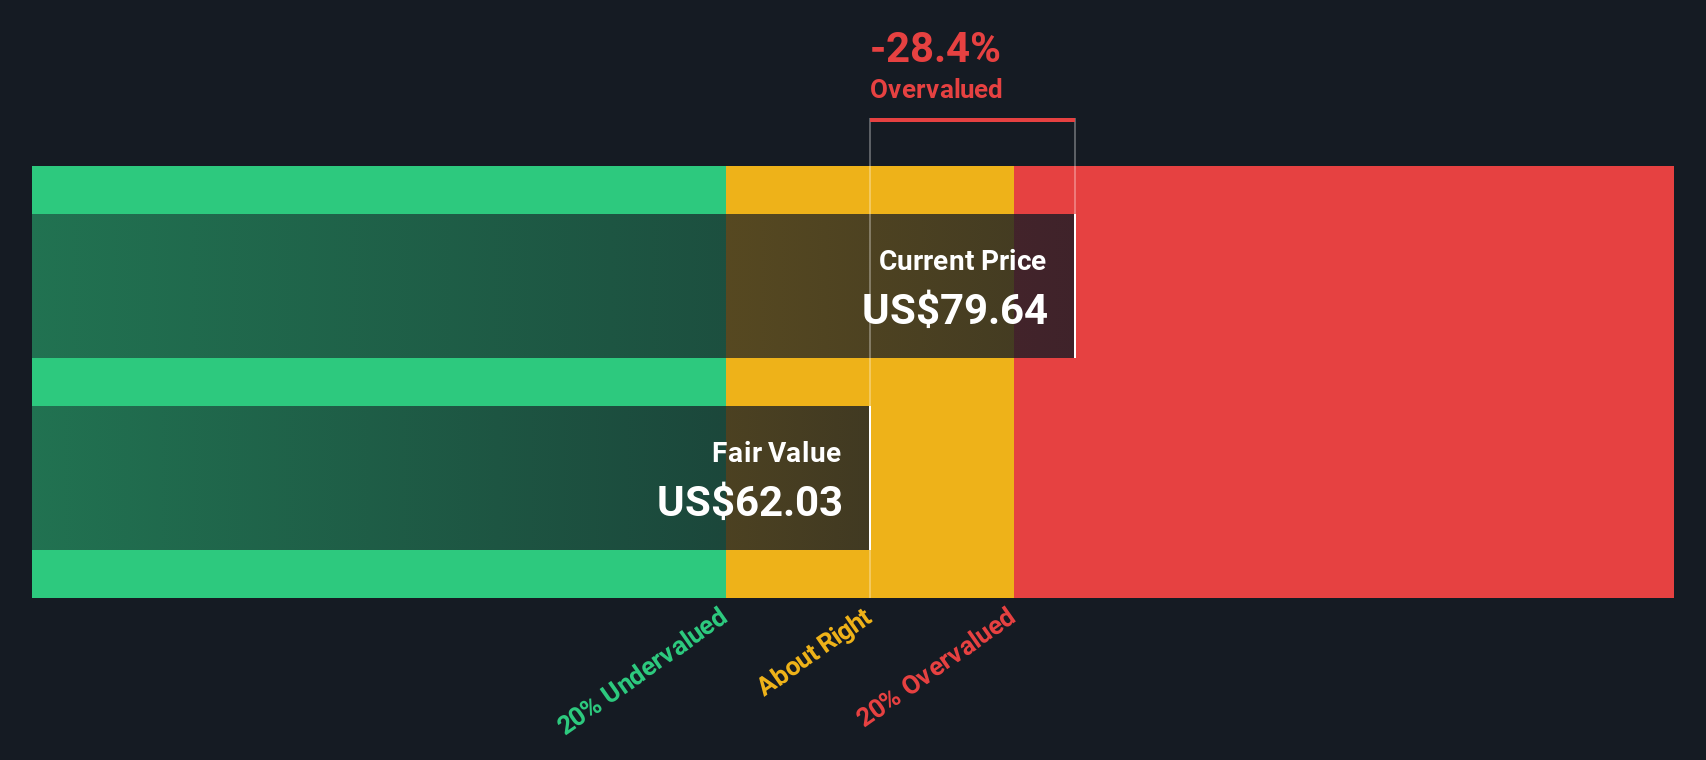
- Willdan Group's estimated fair value is US$62.03 based on 2 Stage Free Cash Flow to Equity
- Willdan Group is estimated to be 28% overvalued based on current share price of US$79.64
- Willdan Group's peers are currently trading at a discount of 29% on average
Does the July share price for Willdan Group, Inc. (NASDAQ:WLDN) reflect what it's really worth? Today, we will estimate the stock's intrinsic value by taking the forecast future cash flows of the company and discounting them back to today's value. This will be done using the Discounted Cash Flow (DCF) model. Models like these may appear beyond the comprehension of a lay person, but they're fairly easy to follow.
Companies can be valued in a lot of ways, so we would point out that a DCF is not perfect for every situation. For those who are keen learners of equity analysis, the Simply Wall St analysis model here may be something of interest to you.
Trump has pledged to "unleash" American oil and gas and these 15 US stocks have developments that are poised to benefit.
The Model
We are going to use a two-stage DCF model, which, as the name states, takes into account two stages of growth. The first stage is generally a higher growth period which levels off heading towards the terminal value, captured in the second 'steady growth' period. To begin with, we have to get estimates of the next ten years of cash flows. Seeing as no analyst estimates of free cash flow are available to us, we have extrapolate the previous free cash flow (FCF) from the company's last reported value. We assume companies with shrinking free cash flow will slow their rate of shrinkage, and that companies with growing free cash flow will see their growth rate slow, over this period. We do this to reflect that growth tends to slow more in the early years than it does in later years.
A DCF is all about the idea that a dollar in the future is less valuable than a dollar today, so we need to discount the sum of these future cash flows to arrive at a present value estimate:
10-year free cash flow (FCF) estimate
| 2026 | 2027 | 2028 | 2029 | 2030 | 2031 | 2032 | 2033 | 2034 | 2035 | |
| Levered FCF ($, Millions) | US$37.1m | US$37.0m | US$37.2m | US$37.7m | US$38.4m | US$39.3m | US$40.2m | US$41.2m | US$42.3m | US$43.5m |
| Growth Rate Estimate Source | Est @ -1.70% | Est @ -0.31% | Est @ 0.67% | Est @ 1.35% | Est @ 1.83% | Est @ 2.16% | Est @ 2.39% | Est @ 2.56% | Est @ 2.67% | Est @ 2.75% |
| Present Value ($, Millions) Discounted @ 6.7% | US$34.8 | US$32.5 | US$30.6 | US$29.1 | US$27.8 | US$26.6 | US$25.5 | US$24.5 | US$23.6 | US$22.7 |
("Est" = FCF growth rate estimated by Simply Wall St)Present Value of 10-year Cash Flow (PVCF) = US$278m
We now need to calculate the Terminal Value, which accounts for all the future cash flows after this ten year period. The Gordon Growth formula is used to calculate Terminal Value at a future annual growth rate equal to the 5-year average of the 10-year government bond yield of 2.9%. We discount the terminal cash flows to today's value at a cost of equity of 6.7%.
Terminal Value (TV)= FCF2035 × (1 + g) ÷ (r – g) = US$43m× (1 + 2.9%) ÷ (6.7%– 2.9%) = US$1.2b
Present Value of Terminal Value (PVTV)= TV / (1 + r)10= US$1.2b÷ ( 1 + 6.7%)10= US$621m
The total value, or equity value, is then the sum of the present value of the future cash flows, which in this case is US$899m. The last step is to then divide the equity value by the number of shares outstanding. Relative to the current share price of US$79.6, the company appears slightly overvalued at the time of writing. Valuations are imprecise instruments though, rather like a telescope - move a few degrees and end up in a different galaxy. Do keep this in mind.
Important Assumptions
We would point out that the most important inputs to a discounted cash flow are the discount rate and of course the actual cash flows. If you don't agree with these result, have a go at the calculation yourself and play with the assumptions. The DCF also does not consider the possible cyclicality of an industry, or a company's future capital requirements, so it does not give a full picture of a company's potential performance. Given that we are looking at Willdan Group as potential shareholders, the cost of equity is used as the discount rate, rather than the cost of capital (or weighted average cost of capital, WACC) which accounts for debt. In this calculation we've used 6.7%, which is based on a levered beta of 0.870. Beta is a measure of a stock's volatility, compared to the market as a whole. We get our beta from the industry average beta of globally comparable companies, with an imposed limit between 0.8 and 2.0, which is a reasonable range for a stable business.
Check out our latest analysis for Willdan Group
SWOT Analysis for Willdan Group
- Earnings growth over the past year exceeded the industry.
- Debt is not viewed as a risk.
- Balance sheet summary for WLDN.
- Expensive based on P/E ratio and estimated fair value.
- What are analysts forecasting for WLDN?
- Annual earnings are forecast to grow faster than the American market.
- No apparent threats visible for WLDN.
Looking Ahead:
Although the valuation of a company is important, it shouldn't be the only metric you look at when researching a company. It's not possible to obtain a foolproof valuation with a DCF model. Preferably you'd apply different cases and assumptions and see how they would impact the company's valuation. If a company grows at a different rate, or if its cost of equity or risk free rate changes sharply, the output can look very different. Why is the intrinsic value lower than the current share price? For Willdan Group, there are three additional items you should further research:
- Financial Health: Does WLDN have a healthy balance sheet? Take a look at our free balance sheet analysis with six simple checks on key factors like leverage and risk.
- Future Earnings: How does WLDN's growth rate compare to its peers and the wider market? Dig deeper into the analyst consensus number for the upcoming years by interacting with our free analyst growth expectation chart.
- Other High Quality Alternatives: Do you like a good all-rounder? Explore our interactive list of high quality stocks to get an idea of what else is out there you may be missing!
PS. Simply Wall St updates its DCF calculation for every American stock every day, so if you want to find the intrinsic value of any other stock just search here.
Valuation is complex, but we're here to simplify it.
Discover if Willdan Group might be undervalued or overvalued with our detailed analysis, featuring fair value estimates, potential risks, dividends, insider trades, and its financial condition.
Access Free AnalysisHave feedback on this article? Concerned about the content? Get in touch with us directly. Alternatively, email editorial-team (at) simplywallst.com.This article by Simply Wall St is general in nature. We provide commentary based on historical data and analyst forecasts only using an unbiased methodology and our articles are not intended to be financial advice. It does not constitute a recommendation to buy or sell any stock, and does not take account of your objectives, or your financial situation. We aim to bring you long-term focused analysis driven by fundamental data. Note that our analysis may not factor in the latest price-sensitive company announcements or qualitative material. Simply Wall St has no position in any stocks mentioned.
免責聲明:投資有風險,本文並非投資建議,以上內容不應被視為任何金融產品的購買或出售要約、建議或邀請,作者或其他用戶的任何相關討論、評論或帖子也不應被視為此類內容。本文僅供一般參考,不考慮您的個人投資目標、財務狀況或需求。TTM對信息的準確性和完整性不承擔任何責任或保證,投資者應自行研究並在投資前尋求專業建議。
熱議股票
- 1
- 2
- 3
- 4
- 5
- 6
- 7
- 8
- 9
- 10