Investors Aren't Buying Wanjia Group Holdings Limited's (HKG:401) Revenues
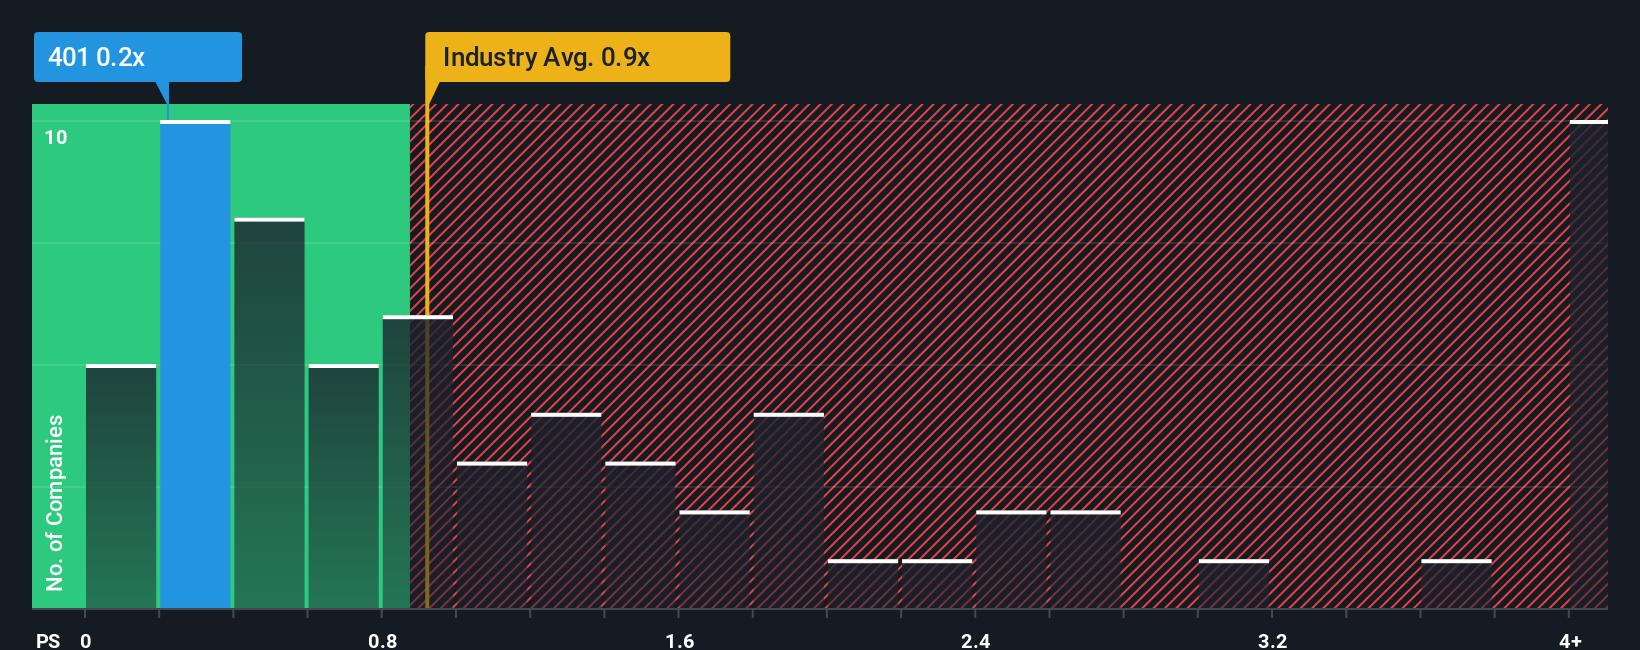
When you see that almost half of the companies in the Healthcare industry in Hong Kong have price-to-sales ratios (or "P/S") above 0.9x, Wanjia Group Holdings Limited (HKG:401) looks to be giving off some buy signals with its 0.2x P/S ratio. However, the P/S might be low for a reason and it requires further investigation to determine if it's justified.
AI is about to change healthcare. These 20 stocks are working on everything from early diagnostics to drug discovery. The best part - they are all under $10bn in marketcap - there is still time to get in early.
See our latest analysis for Wanjia Group Holdings
What Does Wanjia Group Holdings' Recent Performance Look Like?
For example, consider that Wanjia Group Holdings' financial performance has been poor lately as its revenue has been in decline. Perhaps the market believes the recent revenue performance isn't good enough to keep up the industry, causing the P/S ratio to suffer. Those who are bullish on Wanjia Group Holdings will be hoping that this isn't the case so that they can pick up the stock at a lower valuation.
Want the full picture on earnings, revenue and cash flow for the company? Then our free report on Wanjia Group Holdings will help you shine a light on its historical performance.How Is Wanjia Group Holdings' Revenue Growth Trending?
The only time you'd be truly comfortable seeing a P/S as low as Wanjia Group Holdings' is when the company's growth is on track to lag the industry.
In reviewing the last year of financials, we were disheartened to see the company's revenues fell to the tune of 11%. At least revenue has managed not to go completely backwards from three years ago in aggregate, thanks to the earlier period of growth. Accordingly, shareholders probably wouldn't have been overly satisfied with the unstable medium-term growth rates.
This is in contrast to the rest of the industry, which is expected to grow by 8.1% over the next year, materially higher than the company's recent medium-term annualised growth rates.
With this information, we can see why Wanjia Group Holdings is trading at a P/S lower than the industry. It seems most investors are expecting to see the recent limited growth rates continue into the future and are only willing to pay a reduced amount for the stock.
What Does Wanjia Group Holdings' P/S Mean For Investors?
Typically, we'd caution against reading too much into price-to-sales ratios when settling on investment decisions, though it can reveal plenty about what other market participants think about the company.
Our examination of Wanjia Group Holdings confirms that the company's revenue trends over the past three-year years are a key factor in its low price-to-sales ratio, as we suspected, given they fall short of current industry expectations. At this stage investors feel the potential for an improvement in revenue isn't great enough to justify a higher P/S ratio. Unless the recent medium-term conditions improve, they will continue to form a barrier for the share price around these levels.
Before you take the next step, you should know about the 2 warning signs for Wanjia Group Holdings that we have uncovered.
If these risks are making you reconsider your opinion on Wanjia Group Holdings, explore our interactive list of high quality stocks to get an idea of what else is out there.
Valuation is complex, but we're here to simplify it.
Discover if Wanjia Group Holdings might be undervalued or overvalued with our detailed analysis, featuring fair value estimates, potential risks, dividends, insider trades, and its financial condition.
Access Free AnalysisHave feedback on this article? Concerned about the content? Get in touch with us directly. Alternatively, email editorial-team (at) simplywallst.com.This article by Simply Wall St is general in nature. We provide commentary based on historical data and analyst forecasts only using an unbiased methodology and our articles are not intended to be financial advice. It does not constitute a recommendation to buy or sell any stock, and does not take account of your objectives, or your financial situation. We aim to bring you long-term focused analysis driven by fundamental data. Note that our analysis may not factor in the latest price-sensitive company announcements or qualitative material. Simply Wall St has no position in any stocks mentioned.
免責聲明:投資有風險,本文並非投資建議,以上內容不應被視為任何金融產品的購買或出售要約、建議或邀請,作者或其他用戶的任何相關討論、評論或帖子也不應被視為此類內容。本文僅供一般參考,不考慮您的個人投資目標、財務狀況或需求。TTM對信息的準確性和完整性不承擔任何責任或保證,投資者應自行研究並在投資前尋求專業建議。
熱議股票
- 1
- 2
- 3
- 4
- 5
- 6
- 7
- 8
- 9
- 10