Asian Dividend Stocks: Top 3 Picks For Your Portfolio
As global markets navigate a complex landscape marked by inflationary pressures and geopolitical tensions, Asian economies continue to present unique opportunities for investors seeking stability and growth. In this environment, dividend stocks have gained attention as they offer potential income streams while providing a cushion against market volatility.
Top 10 Dividend Stocks In Asia
| Name | Dividend Yield | Dividend Rating |
| Yamato Kogyo (TSE:5444) | 4.43% | ★★★★★★ |
| Wuliangye YibinLtd (SZSE:000858) | 5.12% | ★★★★★★ |
| NCD (TSE:4783) | 4.21% | ★★★★★★ |
| Japan Excellent (TSE:8987) | 4.27% | ★★★★★★ |
| HUAYU Automotive Systems (SHSE:600741) | 4.36% | ★★★★★★ |
| Guangxi LiuYao Group (SHSE:603368) | 4.31% | ★★★★★★ |
| GakkyushaLtd (TSE:9769) | 4.53% | ★★★★★★ |
| E J Holdings (TSE:2153) | 4.79% | ★★★★★★ |
| Daito Trust ConstructionLtd (TSE:1878) | 4.44% | ★★★★★★ |
| CAC Holdings (TSE:4725) | 5.00% | ★★★★★★ |
Click here to see the full list of 1203 stocks from our Top Asian Dividend Stocks screener.
Let's dive into some prime choices out of the screener.
Best Mart 360 Holdings (SEHK:2360)
Simply Wall St Dividend Rating: ★★★★☆☆
Overview: Best Mart 360 Holdings Limited is an investment holding company that operates chain retail stores under the Best Mart 360 and FoodVille brands in Hong Kong, Macau, and the People’s Republic of China, with a market cap of HK$2.11 billion.
Operations: Best Mart 360 Holdings Limited generates revenue primarily through its retailing sales of food and beverage, household, and personal care products, amounting to HK$2.81 billion.
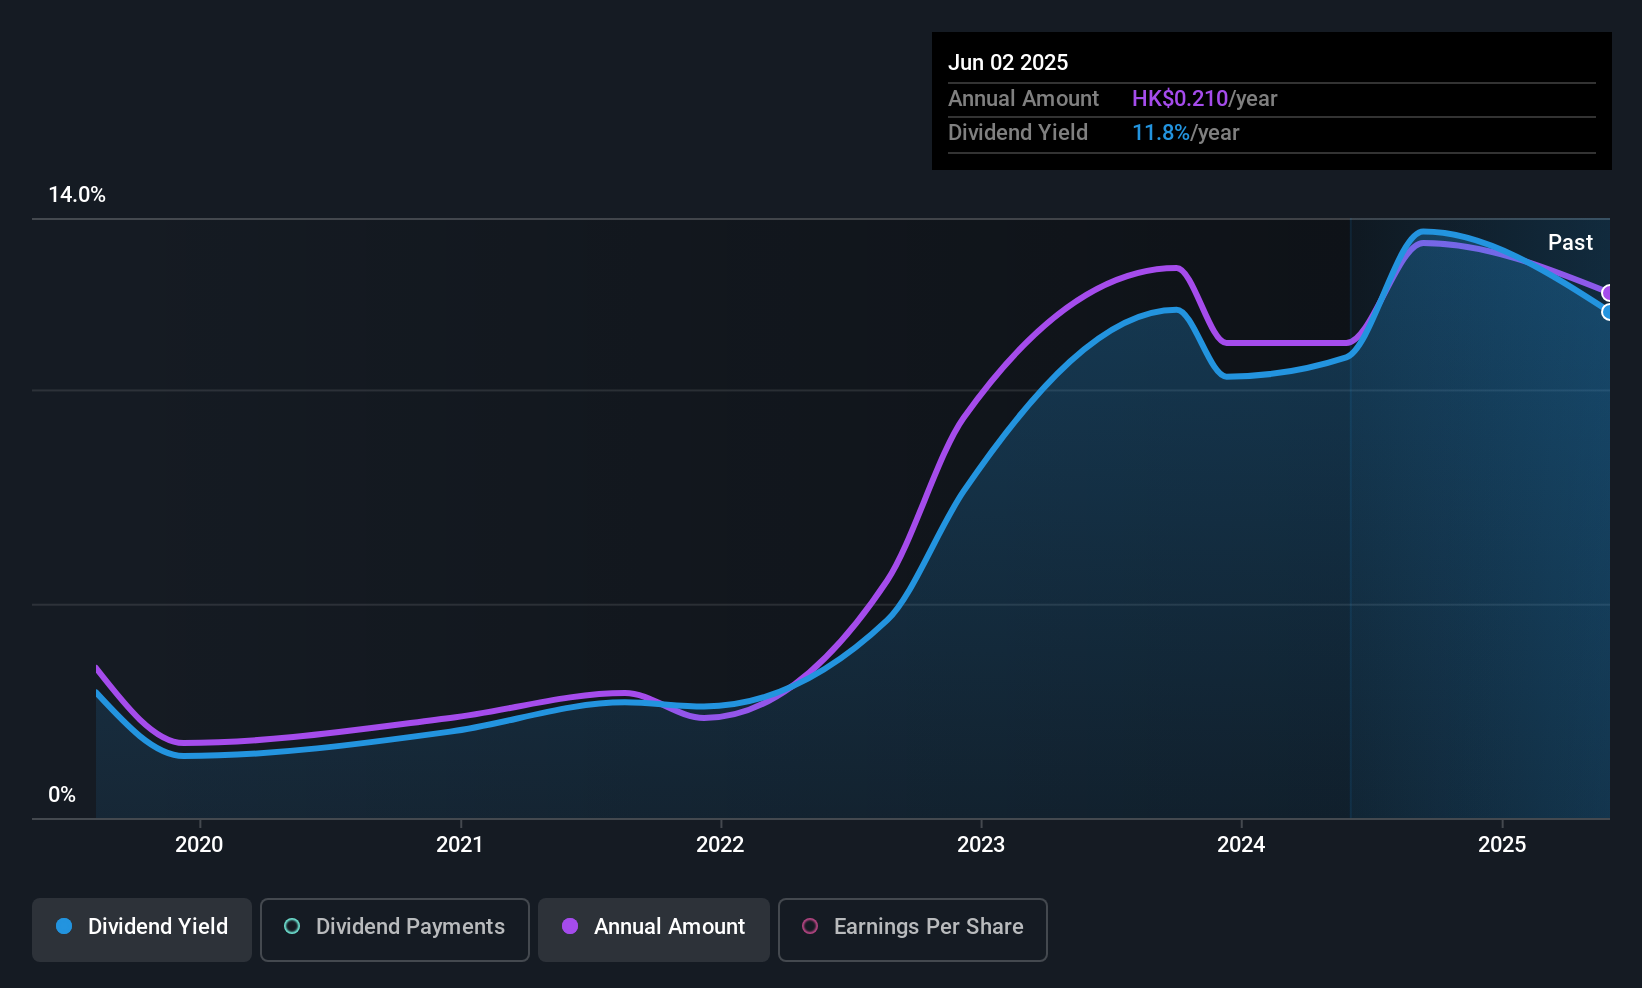
Dividend Yield: 10%
Best Mart 360 Holdings offers a compelling dividend yield of 9.95%, placing it in the top 25% of Hong Kong's dividend payers. Despite earnings growth of 10.3% last year, the company trades at a significant discount to its estimated fair value. However, its six-year dividend history is marked by volatility and an unstable track record, with dividends covered by both earnings (84.8%) and cash flows (52.3%). Recent approval for a final HK$0.10 per share dividend highlights ongoing shareholder returns amidst these challenges.
- Click to explore a detailed breakdown of our findings in Best Mart 360 Holdings' dividend report.
- Our valuation report here indicates Best Mart 360 Holdings may be undervalued.
Cortina Holdings (SGX:C41)
Simply Wall St Dividend Rating: ★★★★☆☆
Overview: Cortina Holdings Limited is an investment holding company that distributes and retails timepieces and accessories across Singapore, Malaysia, Thailand, Indonesia, Hong Kong, Taiwan, and internationally with a market cap of SGD620.92 million.
Operations: Cortina Holdings Limited generates revenue primarily through its retail segment, which accounts for SGD809.40 million, and its wholesale segment, contributing SGD115.04 million.
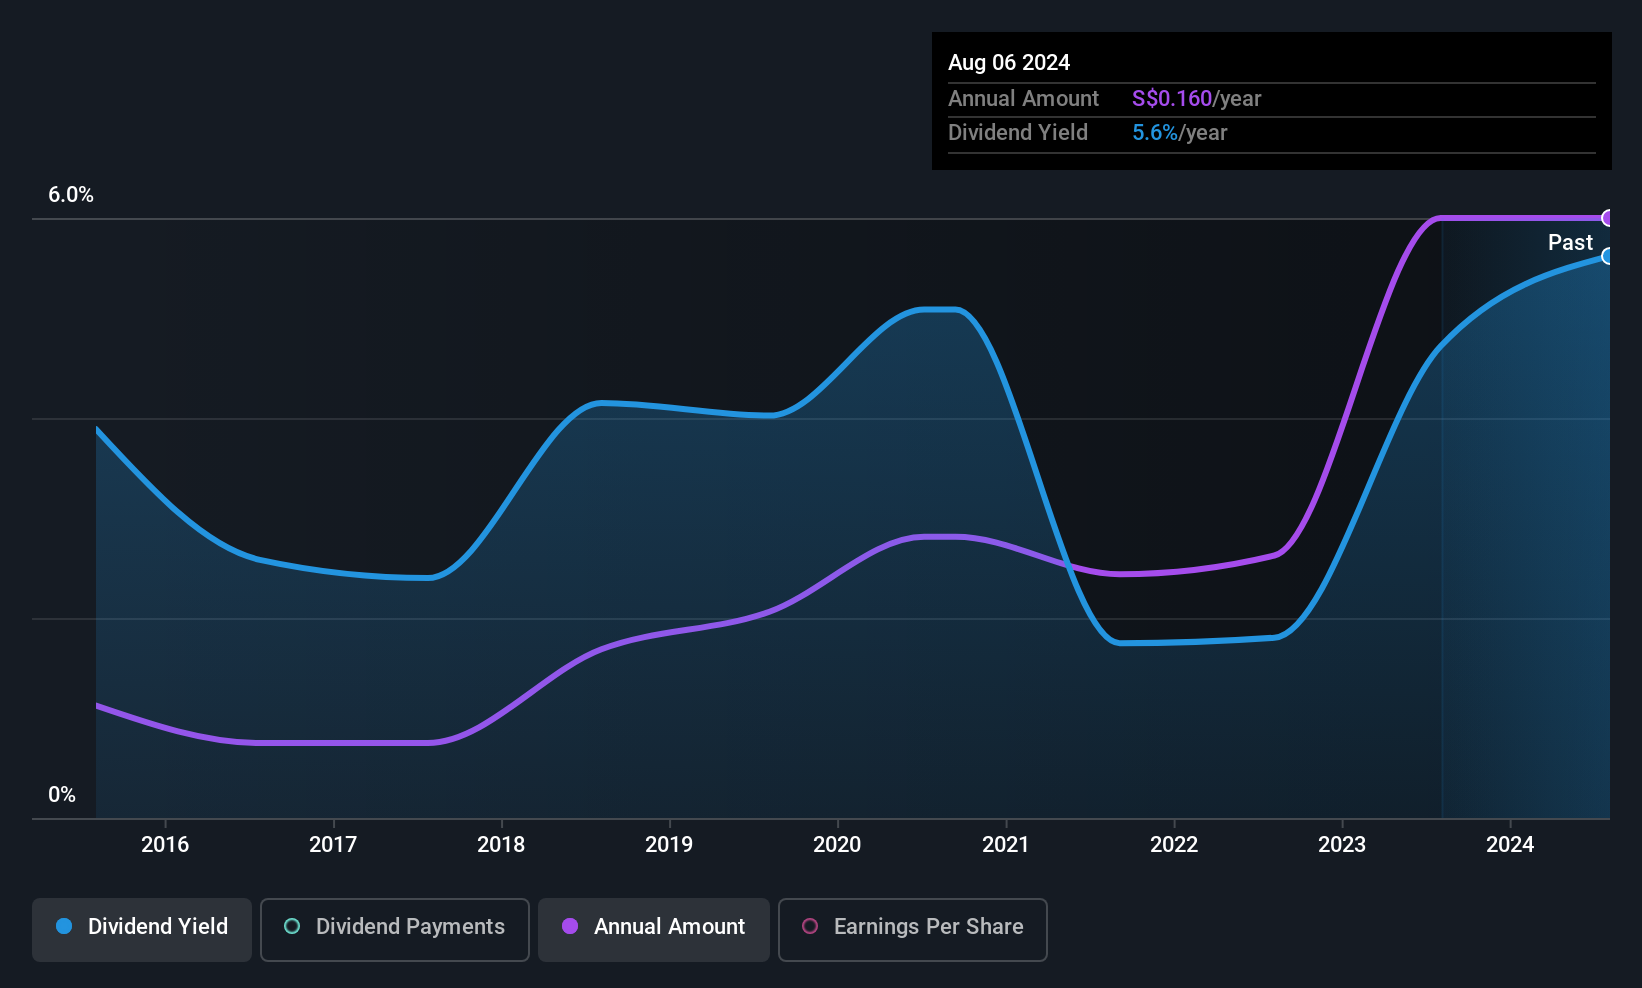
Dividend Yield: 4.3%
Cortina Holdings has announced a special dividend of S$0.14 and a final dividend of S$0.02 per share, pending approval at the upcoming AGM. The company's earnings have grown steadily, with sales reaching S$862.78 million this year. Despite its low payout ratio (5.2%), Cortina's dividends are well-covered by both earnings and cash flows (55.6%). However, its dividend history is marked by volatility, offering less stability compared to top-tier payers in Singapore's market.
- Take a closer look at Cortina Holdings' potential here in our dividend report.
- Our comprehensive valuation report raises the possibility that Cortina Holdings is priced higher than what may be justified by its financials.
L&K Engineering (TWSE:6139)
Simply Wall St Dividend Rating: ★★★★☆☆
Overview: L&K Engineering Co., Ltd. offers turnkey engineering services in Taiwan, Hong Kong, and internationally, with a market cap of NT$80.50 billion.
Operations: L&K Engineering Co., Ltd.'s revenue segments include L1 Company with NT$22.75 billion, L2 Company with NT$17.21 billion, and The Company with NT$19.92 billion.
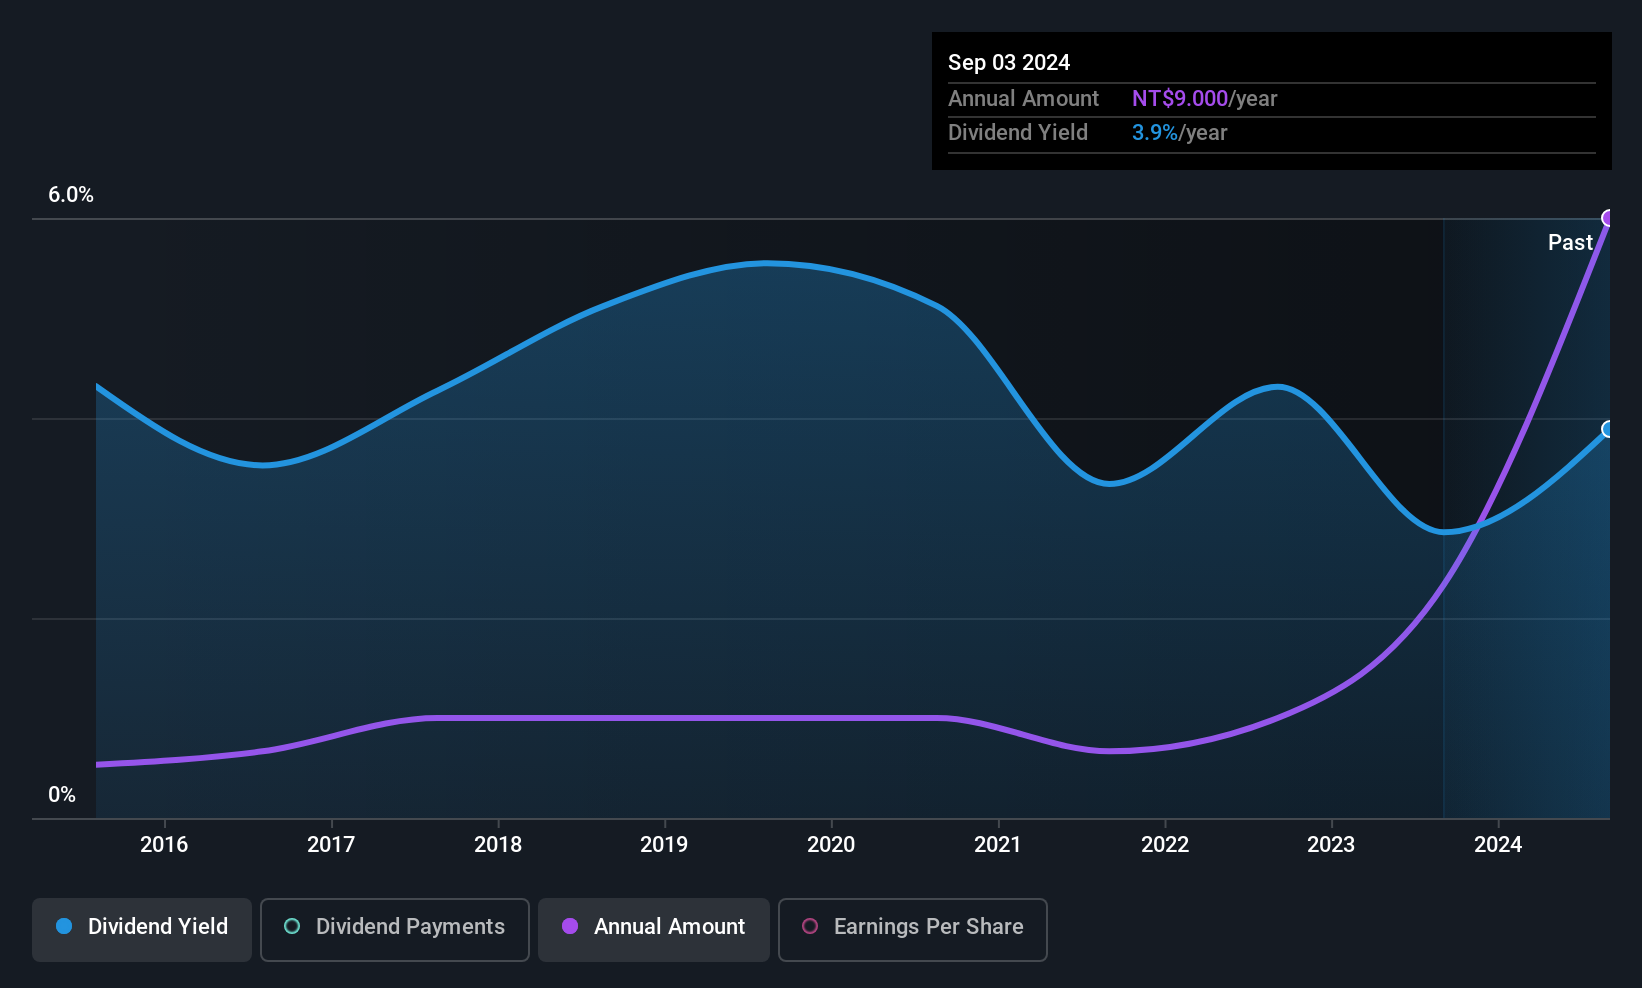
Dividend Yield: 4.1%
L&K Engineering's dividend payments, totaling TWD 3.27 billion, are scheduled for distribution on September 30, 2025. Despite a volatile dividend history with past annual drops over 20%, the current payout ratio of 76.1% indicates coverage by earnings and a low cash payout ratio of 31.8% suggests strong cash flow support. Recent earnings show a decline in sales to TWD 12.07 billion from TWD 19.17 billion year-on-year, impacting net income slightly at TWD 885 million compared to last year's TWD 931 million.
- Navigate through the intricacies of L&K Engineering with our comprehensive dividend report here.
- Upon reviewing our latest valuation report, L&K Engineering's share price might be too pessimistic.
Where To Now?
- Dive into all 1203 of the Top Asian Dividend Stocks we have identified here.
- Already own these companies? Link your portfolio to Simply Wall St and get alerts on any new warning signs to your stocks.
- Maximize your investment potential with Simply Wall St, the comprehensive app that offers global market insights for free.
Ready To Venture Into Other Investment Styles?
- Explore high-performing small cap companies that haven't yet garnered significant analyst attention.
- Fuel your portfolio with companies showing strong growth potential, backed by optimistic outlooks both from analysts and management.
- Find companies with promising cash flow potential yet trading below their fair value.
This article by Simply Wall St is general in nature. We provide commentary based on historical data and analyst forecasts only using an unbiased methodology and our articles are not intended to be financial advice. It does not constitute a recommendation to buy or sell any stock, and does not take account of your objectives, or your financial situation. We aim to bring you long-term focused analysis driven by fundamental data. Note that our analysis may not factor in the latest price-sensitive company announcements or qualitative material. Simply Wall St has no position in any stocks mentioned.
Valuation is complex, but we're here to simplify it.
Discover if Best Mart 360 Holdings might be undervalued or overvalued with our detailed analysis, featuring fair value estimates, potential risks, dividends, insider trades, and its financial condition.
Access Free AnalysisHave feedback on this article? Concerned about the content? Get in touch with us directly. Alternatively, email editorial-team@simplywallst.com
免責聲明:投資有風險,本文並非投資建議,以上內容不應被視為任何金融產品的購買或出售要約、建議或邀請,作者或其他用戶的任何相關討論、評論或帖子也不應被視為此類內容。本文僅供一般參考,不考慮您的個人投資目標、財務狀況或需求。TTM對信息的準確性和完整性不承擔任何責任或保證,投資者應自行研究並在投資前尋求專業建議。
熱議股票
- 1
- 2
- 3
- 4
- 5
- 6
- 7
- 8
- 9
- 10