Even With A 38% Surge, Cautious Investors Are Not Rewarding Pentanet Limited's (ASX:5GG) Performance Completely
Those holding Pentanet Limited (ASX:5GG) shares would be relieved that the share price has rebounded 38% in the last thirty days, but it needs to keep going to repair the recent damage it has caused to investor portfolios. Unfortunately, the gains of the last month did little to right the losses of the last year with the stock still down 20% over that time.
Although its price has surged higher, it's still not a stretch to say that Pentanet's price-to-sales (or "P/S") ratio of 0.7x right now seems quite "middle-of-the-road" compared to the Telecom industry in Australia, where the median P/S ratio is around 1x. While this might not raise any eyebrows, if the P/S ratio is not justified investors could be missing out on a potential opportunity or ignoring looming disappointment.
AI is about to change healthcare. These 20 stocks are working on everything from early diagnostics to drug discovery. The best part - they are all under $10bn in marketcap - there is still time to get in early.
View our latest analysis for Pentanet
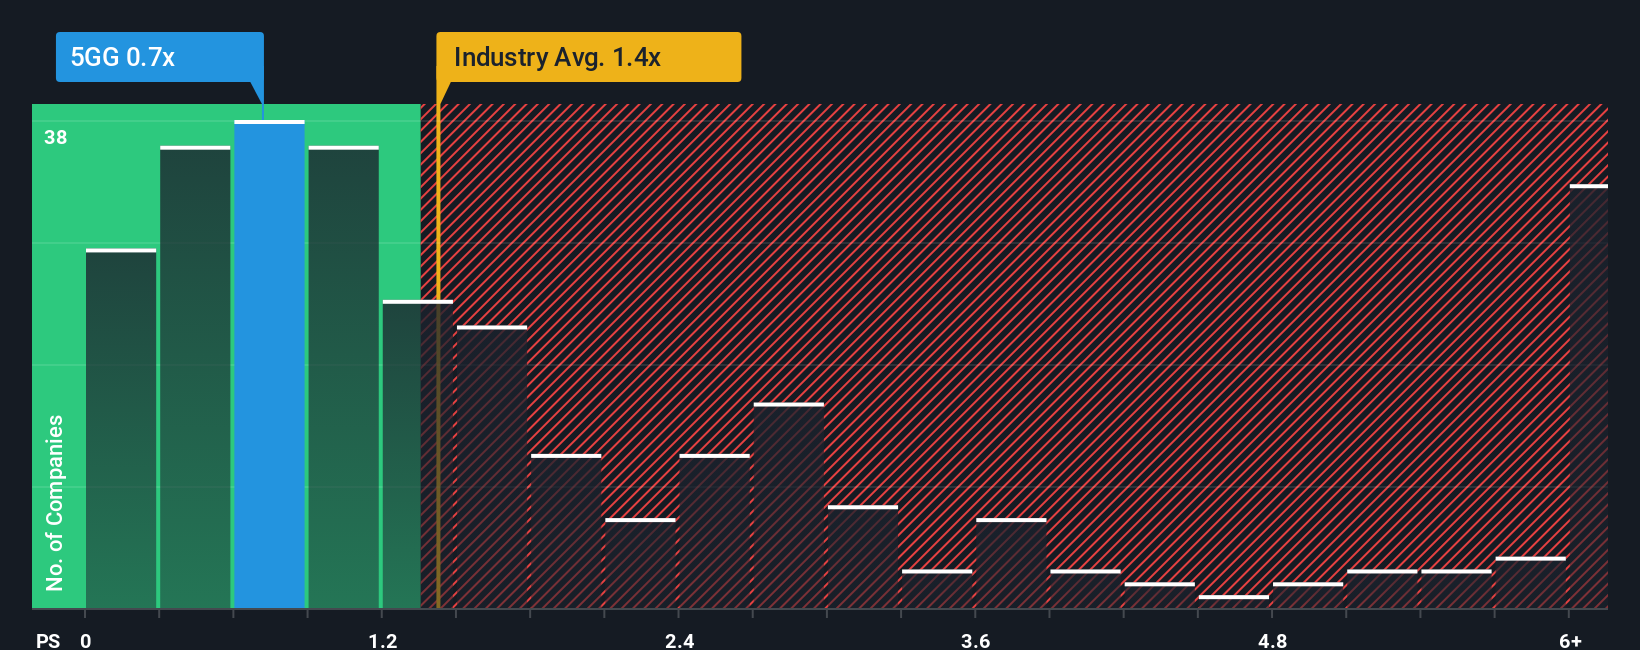
What Does Pentanet's P/S Mean For Shareholders?
Revenue has risen at a steady rate over the last year for Pentanet, which is generally not a bad outcome. One possibility is that the P/S is moderate because investors think this good revenue growth might only be parallel to the broader industry in the near future. If you like the company, you'd be hoping this isn't the case so that you could potentially pick up some stock while it's not quite in favour.
We don't have analyst forecasts, but you can see how recent trends are setting up the company for the future by checking out our free report on Pentanet's earnings, revenue and cash flow.What Are Revenue Growth Metrics Telling Us About The P/S?
The only time you'd be comfortable seeing a P/S like Pentanet's is when the company's growth is tracking the industry closely.
Retrospectively, the last year delivered a decent 4.1% gain to the company's revenues. This was backed up an excellent period prior to see revenue up by 55% in total over the last three years. So we can start by confirming that the company has done a great job of growing revenues over that time.
Comparing that recent medium-term revenue trajectory with the industry's one-year growth forecast of 5.2% shows it's noticeably more attractive.
In light of this, it's curious that Pentanet's P/S sits in line with the majority of other companies. It may be that most investors are not convinced the company can maintain its recent growth rates.
The Bottom Line On Pentanet's P/S
Its shares have lifted substantially and now Pentanet's P/S is back within range of the industry median. Using the price-to-sales ratio alone to determine if you should sell your stock isn't sensible, however it can be a practical guide to the company's future prospects.
We didn't quite envision Pentanet's P/S sitting in line with the wider industry, considering the revenue growth over the last three-year is higher than the current industry outlook. When we see strong revenue with faster-than-industry growth, we can only assume potential risks are what might be placing pressure on the P/S ratio. While recent revenue trends over the past medium-term suggest that the risk of a price decline is low, investors appear to see the likelihood of revenue fluctuations in the future.
You need to take note of risks, for example - Pentanet has 3 warning signs (and 1 which shouldn't be ignored) we think you should know about.
Of course, profitable companies with a history of great earnings growth are generally safer bets. So you may wish to see this free collection of other companies that have reasonable P/E ratios and have grown earnings strongly.
New: Manage All Your Stock Portfolios in One Place
We've created the ultimate portfolio companion for stock investors, and it's free.
• Connect an unlimited number of Portfolios and see your total in one currency• Be alerted to new Warning Signs or Risks via email or mobile• Track the Fair Value of your stocks
Try a Demo Portfolio for FreeHave feedback on this article? Concerned about the content? Get in touch with us directly. Alternatively, email editorial-team (at) simplywallst.com.This article by Simply Wall St is general in nature. We provide commentary based on historical data and analyst forecasts only using an unbiased methodology and our articles are not intended to be financial advice. It does not constitute a recommendation to buy or sell any stock, and does not take account of your objectives, or your financial situation. We aim to bring you long-term focused analysis driven by fundamental data. Note that our analysis may not factor in the latest price-sensitive company announcements or qualitative material. Simply Wall St has no position in any stocks mentioned.
免責聲明:投資有風險,本文並非投資建議,以上內容不應被視為任何金融產品的購買或出售要約、建議或邀請,作者或其他用戶的任何相關討論、評論或帖子也不應被視為此類內容。本文僅供一般參考,不考慮您的個人投資目標、財務狀況或需求。TTM對信息的準確性和完整性不承擔任何責任或保證,投資者應自行研究並在投資前尋求專業建議。
熱議股票
- 1
- 2
- 3
- 4
- 5
- 6
- 7
- 8
- 9
- 10