Sarine Technologies Ltd.'s (SGX:U77) Stock Going Strong But Fundamentals Look Weak: What Implications Could This Have On The Stock?
Most readers would already be aware that Sarine Technologies' (SGX:U77) stock increased significantly by 19% over the past month. We, however wanted to have a closer look at its key financial indicators as the markets usually pay for long-term fundamentals, and in this case, they don't look very promising. Particularly, we will be paying attention to Sarine Technologies' ROE today.
Return on Equity or ROE is a test of how effectively a company is growing its value and managing investors’ money. In short, ROE shows the profit each dollar generates with respect to its shareholder investments.
Trump has pledged to "unleash" American oil and gas and these 15 US stocks have developments that are poised to benefit.
How To Calculate Return On Equity?
Return on equity can be calculated by using the formula:
Return on Equity = Net Profit (from continuing operations) ÷ Shareholders' Equity
So, based on the above formula, the ROE for Sarine Technologies is:
1.9% = US$1.1m ÷ US$57m (Based on the trailing twelve months to December 2024).
The 'return' is the yearly profit. So, this means that for every SGD1 of its shareholder's investments, the company generates a profit of SGD0.02.
View our latest analysis for Sarine Technologies
Why Is ROE Important For Earnings Growth?
So far, we've learned that ROE is a measure of a company's profitability. Depending on how much of these profits the company reinvests or "retains", and how effectively it does so, we are then able to assess a company’s earnings growth potential. Assuming everything else remains unchanged, the higher the ROE and profit retention, the higher the growth rate of a company compared to companies that don't necessarily bear these characteristics.
A Side By Side comparison of Sarine Technologies' Earnings Growth And 1.9% ROE
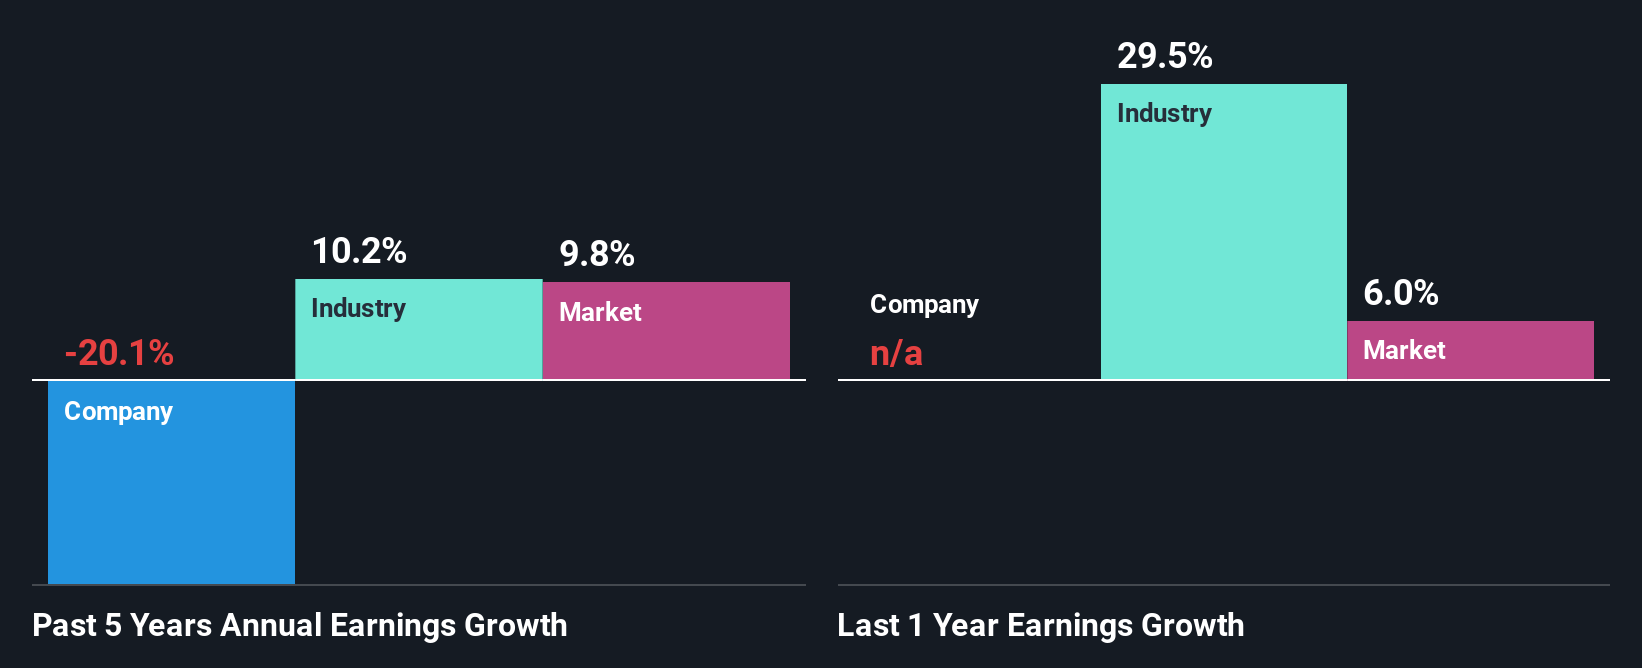
It is hard to argue that Sarine Technologies' ROE is much good in and of itself. Not just that, even compared to the industry average of 4.2%, the company's ROE is entirely unremarkable. Given the circumstances, the significant decline in net income by 20% seen by Sarine Technologies over the last five years is not surprising. We believe that there also might be other aspects that are negatively influencing the company's earnings prospects. For example, the business has allocated capital poorly, or that the company has a very high payout ratio.
However, when we compared Sarine Technologies' growth with the industry we found that while the company's earnings have been shrinking, the industry has seen an earnings growth of 10% in the same period. This is quite worrisome.
Earnings growth is an important metric to consider when valuing a stock. It’s important for an investor to know whether the market has priced in the company's expected earnings growth (or decline). This then helps them determine if the stock is placed for a bright or bleak future. If you're wondering about Sarine Technologies''s valuation, check out this gauge of its price-to-earnings ratio, as compared to its industry.
Is Sarine Technologies Using Its Retained Earnings Effectively?
With a high three-year median payout ratio of 67% (implying that 33% of the profits are retained), most of Sarine Technologies' profits are being paid to shareholders, which explains the company's shrinking earnings. With only very little left to reinvest into the business, growth in earnings is far from likely. To know the 2 risks we have identified for Sarine Technologies visit our risks dashboard for free.
In addition, Sarine Technologies has been paying dividends over a period of at least ten years suggesting that keeping up dividend payments is way more important to the management even if it comes at the cost of business growth.
Summary
In total, we would have a hard think before deciding on any investment action concerning Sarine Technologies. The company has seen a lack of earnings growth as a result of retaining very little profits and whatever little it does retain, is being reinvested at a very low rate of return. So far, we've only made a quick discussion around the company's earnings growth. So it may be worth checking this free detailed graph of Sarine Technologies' past earnings, as well as revenue and cash flows to get a deeper insight into the company's performance.
New: Manage All Your Stock Portfolios in One Place
We've created the ultimate portfolio companion for stock investors, and it's free.
• Connect an unlimited number of Portfolios and see your total in one currency• Be alerted to new Warning Signs or Risks via email or mobile• Track the Fair Value of your stocks
Try a Demo Portfolio for FreeHave feedback on this article? Concerned about the content? Get in touch with us directly. Alternatively, email editorial-team (at) simplywallst.com.This article by Simply Wall St is general in nature. We provide commentary based on historical data and analyst forecasts only using an unbiased methodology and our articles are not intended to be financial advice. It does not constitute a recommendation to buy or sell any stock, and does not take account of your objectives, or your financial situation. We aim to bring you long-term focused analysis driven by fundamental data. Note that our analysis may not factor in the latest price-sensitive company announcements or qualitative material. Simply Wall St has no position in any stocks mentioned.
免責聲明:投資有風險,本文並非投資建議,以上內容不應被視為任何金融產品的購買或出售要約、建議或邀請,作者或其他用戶的任何相關討論、評論或帖子也不應被視為此類內容。本文僅供一般參考,不考慮您的個人投資目標、財務狀況或需求。TTM對信息的準確性和完整性不承擔任何責任或保證,投資者應自行研究並在投資前尋求專業建議。
熱議股票
- 1
- 2
- 3
- 4
- 5
- 6
- 7
- 8
- 9
- 10