The Market Lifts Close the Loop Ltd (ASX:CLG) Shares 63% But It Can Do More
Close the Loop Ltd (ASX:CLG) shareholders are no doubt pleased to see that the share price has bounced 63% in the last month, although it is still struggling to make up recently lost ground. Still, the 30-day jump doesn't change the fact that longer term shareholders have seen their stock decimated by the 86% share price drop in the last twelve months.
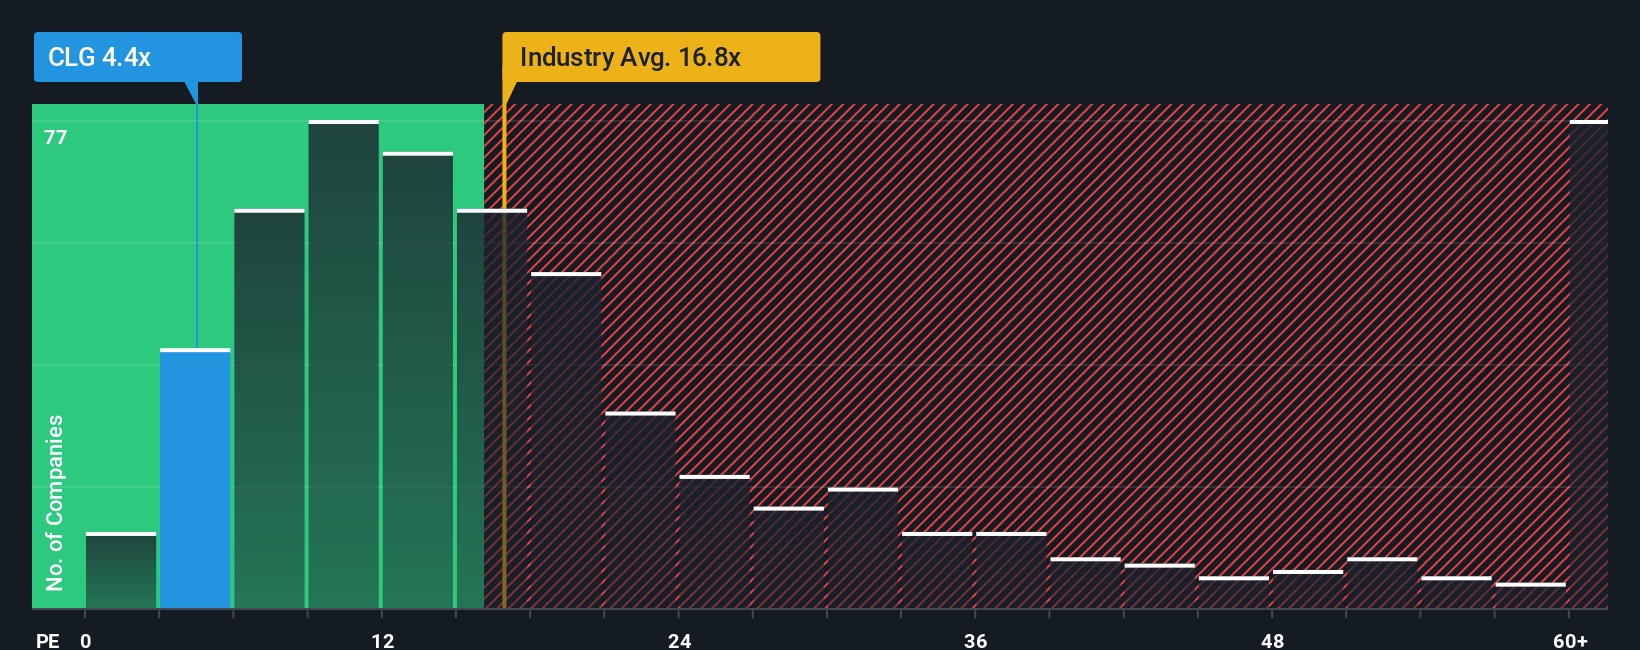
Even after such a large jump in price, Close the Loop's price-to-earnings (or "P/E") ratio of 4.4x might still make it look like a strong buy right now compared to the market in Australia, where around half of the companies have P/E ratios above 19x and even P/E's above 36x are quite common. Nonetheless, we'd need to dig a little deeper to determine if there is a rational basis for the highly reduced P/E.
Trump has pledged to "unleash" American oil and gas and these 15 US stocks have developments that are poised to benefit.
Close the Loop could be doing better as its earnings have been going backwards lately while most other companies have been seeing positive earnings growth. The P/E is probably low because investors think this poor earnings performance isn't going to get any better. If you still like the company, you'd be hoping this isn't the case so that you could potentially pick up some stock while it's out of favour.
Check out our latest analysis for Close the Loop
How Is Close the Loop's Growth Trending?
Close the Loop's P/E ratio would be typical for a company that's expected to deliver very poor growth or even falling earnings, and importantly, perform much worse than the market.
Taking a look back first, the company's earnings per share growth last year wasn't something to get excited about as it posted a disappointing decline of 64%. The last three years don't look nice either as the company has shrunk EPS by 45% in aggregate. Accordingly, shareholders would have felt downbeat about the medium-term rates of earnings growth.
Looking ahead now, EPS is anticipated to climb by 14% per annum during the coming three years according to the only analyst following the company. Meanwhile, the rest of the market is forecast to expand by 15% per annum, which is not materially different.
In light of this, it's peculiar that Close the Loop's P/E sits below the majority of other companies. Apparently some shareholders are doubtful of the forecasts and have been accepting lower selling prices.
The Final Word
Even after such a strong price move, Close the Loop's P/E still trails the rest of the market significantly. Typically, we'd caution against reading too much into price-to-earnings ratios when settling on investment decisions, though it can reveal plenty about what other market participants think about the company.
Our examination of Close the Loop's analyst forecasts revealed that its market-matching earnings outlook isn't contributing to its P/E as much as we would have predicted. When we see an average earnings outlook with market-like growth, we assume potential risks are what might be placing pressure on the P/E ratio. At least the risk of a price drop looks to be subdued, but investors seem to think future earnings could see some volatility.
You need to take note of risks, for example - Close the Loop has 3 warning signs (and 1 which shouldn't be ignored) we think you should know about.
It's important to make sure you look for a great company, not just the first idea you come across. So take a peek at this free list of interesting companies with strong recent earnings growth (and a low P/E).
New: AI Stock Screener & Alerts
Our new AI Stock Screener scans the market every day to uncover opportunities.
• Dividend Powerhouses (3%+ Yield)• Undervalued Small Caps with Insider Buying• High growth Tech and AI CompaniesOr build your own from over 50 metrics.
Explore Now for FreeHave feedback on this article? Concerned about the content? Get in touch with us directly. Alternatively, email editorial-team (at) simplywallst.com.This article by Simply Wall St is general in nature. We provide commentary based on historical data and analyst forecasts only using an unbiased methodology and our articles are not intended to be financial advice. It does not constitute a recommendation to buy or sell any stock, and does not take account of your objectives, or your financial situation. We aim to bring you long-term focused analysis driven by fundamental data. Note that our analysis may not factor in the latest price-sensitive company announcements or qualitative material. Simply Wall St has no position in any stocks mentioned.
免責聲明:投資有風險,本文並非投資建議,以上內容不應被視為任何金融產品的購買或出售要約、建議或邀請,作者或其他用戶的任何相關討論、評論或帖子也不應被視為此類內容。本文僅供一般參考,不考慮您的個人投資目標、財務狀況或需求。TTM對信息的準確性和完整性不承擔任何責任或保證,投資者應自行研究並在投資前尋求專業建議。
熱議股票
- 1
- 2
- 3
- 4
- 5
- 6
- 7
- 8
- 9
- 10