Sonic crypto price on edge as network its a 120m milestone
Sonic crypto price surged for the second consecutive day as the network’s transactions reached the 120 million milestone.
- Sonic price is on edge as its transactions hit the 120 million milestone.
- The stablecoin supply has plunged in the past few months.
- Its total value locked in the DeFi industry has also crashed.
Sonic (S) token soared to a high of $0.3555 on Thursday, up 25% from its lowest point this week. It then pared some of those gains and was trading at $0.3300 at press time.
Sonic transactions hit 120m
Sonic jumped after the developers announced that the layer-1 network crossed 120 million transactions, just six months after its launch.
While this is a notable milestone, there are signs that Sonic is losing momentum, which likely explains why its token pulled back after the initial surge.
Nansen data shows that Sonic’s transactions plunged 202% to 8.6 million in the last 30 days. At the same time, the number of active addresses on the network dropped 40% to 232,000. This slowdown occurred even as other chains like Arbitrum and Linea saw a surge in transactions.
More data shows that the Sonic ecosystem is struggling. According to DeFi Llama, the amount of stablecoin in its ecosystem fell to $209 million, the lowest level since March and well below the year-to-date high of $597 million.
Sonic’s total value locked has also been in a strong downtrend in recent months. After peaking at nearly $2 billion earlier this year, TVL has plunged to $1.2 billion.
Sonic price technical analysis

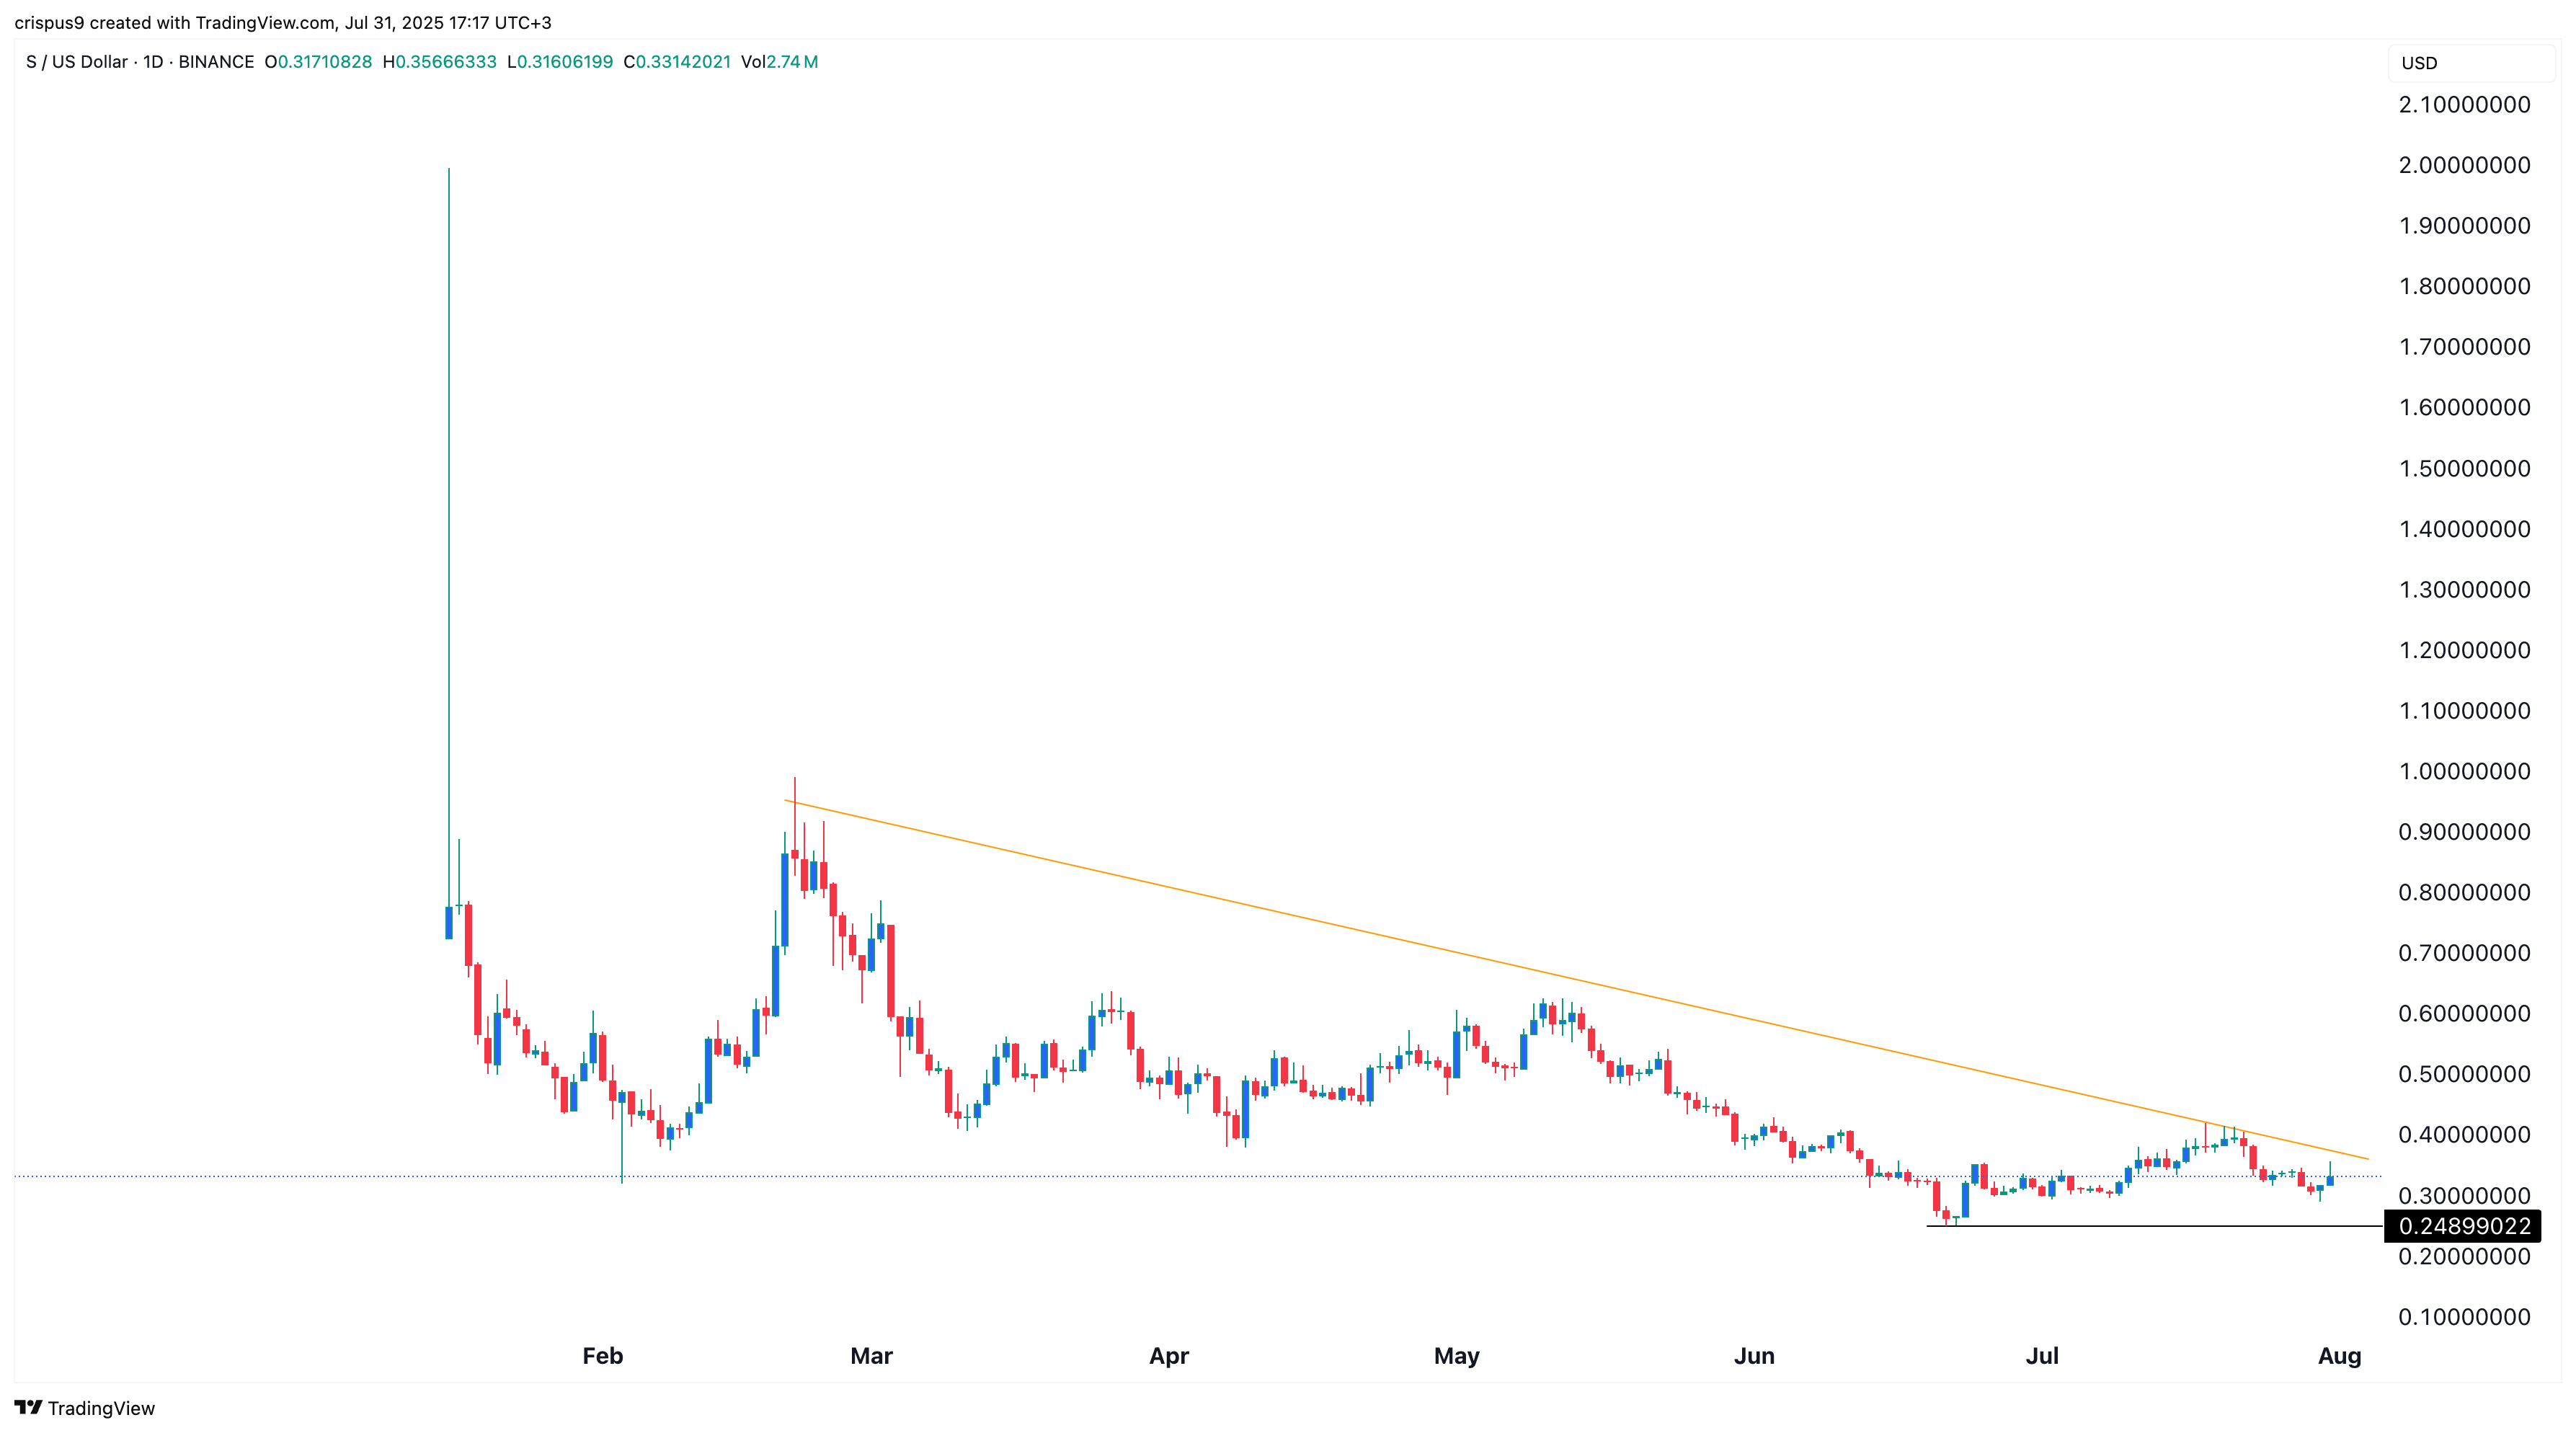
The daily chart shows that the Sonic crypto price has traded sideways in recent days. It was trading at $0.30, a few points above the year-to-date low of $0.2490.
The token has formed a descending triangle pattern, a popular bearish continuation signal. With transactions, DeFi assets, and stablecoin supply falling, there is a risk of a bearish breakdown. If this occurs, the initial target will be the all-time low of $0.2490. A move below that level would signal further downside.
On the flip side, a move above the upper side of the descending channel would confirm a bullish breakout and point to more gains.
免責聲明:投資有風險,本文並非投資建議,以上內容不應被視為任何金融產品的購買或出售要約、建議或邀請,作者或其他用戶的任何相關討論、評論或帖子也不應被視為此類內容。本文僅供一般參考,不考慮您的個人投資目標、財務狀況或需求。TTM對信息的準確性和完整性不承擔任何責任或保證,投資者應自行研究並在投資前尋求專業建議。
熱議股票
- 1
- 2
- 3
- 4
- 5
- 6
- 7
- 8
- 9
- 10