Shenglong Splendecor International (HKG:8481) Has Some Way To Go To Become A Multi-Bagger
There are a few key trends to look for if we want to identify the next multi-bagger. In a perfect world, we'd like to see a company investing more capital into its business and ideally the returns earned from that capital are also increasing. If you see this, it typically means it's a company with a great business model and plenty of profitable reinvestment opportunities. With that in mind, the ROCE of Shenglong Splendecor International (HKG:8481) looks decent, right now, so lets see what the trend of returns can tell us.
AI is about to change healthcare. These 20 stocks are working on everything from early diagnostics to drug discovery. The best part - they are all under $10bn in marketcap - there is still time to get in early.
Return On Capital Employed (ROCE): What Is It?
Just to clarify if you're unsure, ROCE is a metric for evaluating how much pre-tax income (in percentage terms) a company earns on the capital invested in its business. To calculate this metric for Shenglong Splendecor International, this is the formula:
Return on Capital Employed = Earnings Before Interest and Tax (EBIT) ÷ (Total Assets - Current Liabilities)
0.12 = CN¥68m ÷ (CN¥875m - CN¥288m) (Based on the trailing twelve months to December 2024).
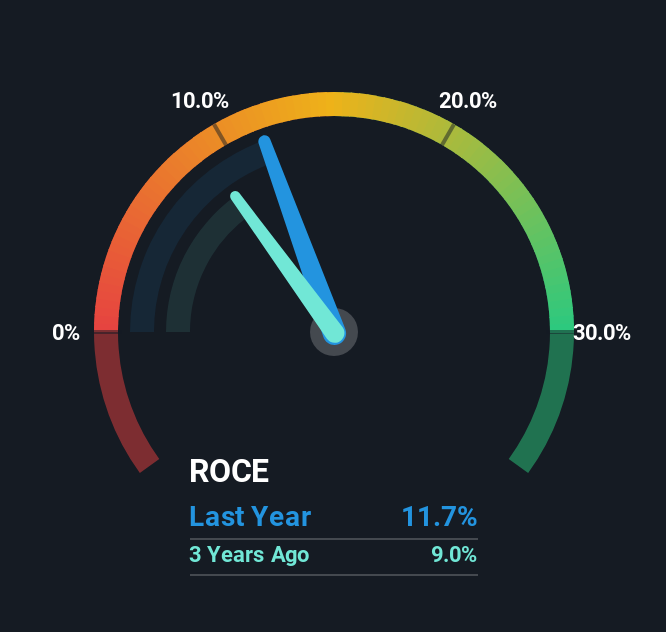
So, Shenglong Splendecor International has an ROCE of 12%. In absolute terms, that's a satisfactory return, but compared to the Commercial Services industry average of 6.8% it's much better.
Check out our latest analysis for Shenglong Splendecor International
While the past is not representative of the future, it can be helpful to know how a company has performed historically, which is why we have this chart above. If you're interested in investigating Shenglong Splendecor International's past further, check out this free graph covering Shenglong Splendecor International's past earnings, revenue and cash flow.
What The Trend Of ROCE Can Tell Us
While the returns on capital are good, they haven't moved much. The company has consistently earned 12% for the last five years, and the capital employed within the business has risen 184% in that time. Since 12% is a moderate ROCE though, it's good to see a business can continue to reinvest at these decent rates of return. Over long periods of time, returns like these might not be too exciting, but with consistency they can pay off in terms of share price returns.
On a side note, Shenglong Splendecor International has done well to reduce current liabilities to 33% of total assets over the last five years. Effectively suppliers now fund less of the business, which can lower some elements of risk.
In Conclusion...
To sum it up, Shenglong Splendecor International has simply been reinvesting capital steadily, at those decent rates of return. And long term investors would be thrilled with the 107% return they've received over the last five years. So even though the stock might be more "expensive" than it was before, we think the strong fundamentals warrant this stock for further research.
If you want to know some of the risks facing Shenglong Splendecor International we've found 5 warning signs (3 make us uncomfortable!) that you should be aware of before investing here.
For those who like to invest in solid companies, check out this free list of companies with solid balance sheets and high returns on equity.
New: Manage All Your Stock Portfolios in One Place
We've created the ultimate portfolio companion for stock investors, and it's free.
• Connect an unlimited number of Portfolios and see your total in one currency• Be alerted to new Warning Signs or Risks via email or mobile• Track the Fair Value of your stocks
Try a Demo Portfolio for FreeHave feedback on this article? Concerned about the content? Get in touch with us directly. Alternatively, email editorial-team (at) simplywallst.com.This article by Simply Wall St is general in nature. We provide commentary based on historical data and analyst forecasts only using an unbiased methodology and our articles are not intended to be financial advice. It does not constitute a recommendation to buy or sell any stock, and does not take account of your objectives, or your financial situation. We aim to bring you long-term focused analysis driven by fundamental data. Note that our analysis may not factor in the latest price-sensitive company announcements or qualitative material. Simply Wall St has no position in any stocks mentioned.
免責聲明:投資有風險,本文並非投資建議,以上內容不應被視為任何金融產品的購買或出售要約、建議或邀請,作者或其他用戶的任何相關討論、評論或帖子也不應被視為此類內容。本文僅供一般參考,不考慮您的個人投資目標、財務狀況或需求。TTM對信息的準確性和完整性不承擔任何責任或保證,投資者應自行研究並在投資前尋求專業建議。
熱議股票
- 1
- 2
- 3
- 4
- 5
- 6
- 7
- 8
- 9
- 10