John Wiley & Sons (NYSE:WLY) shareholders have endured a 18% loss from investing in the stock three years ago
In order to justify the effort of selecting individual stocks, it's worth striving to beat the returns from a market index fund. But its virtually certain that sometimes you will buy stocks that fall short of the market average returns. We regret to report that long term John Wiley & Sons, Inc. (NYSE:WLY) shareholders have had that experience, with the share price dropping 26% in three years, versus a market return of about 54%. Furthermore, it's down 14% in about a quarter. That's not much fun for holders.
Since shareholders are down over the longer term, lets look at the underlying fundamentals over the that time and see if they've been consistent with returns.
This technology could replace computers: discover the 20 stocks are working to make quantum computing a reality.
While markets are a powerful pricing mechanism, share prices reflect investor sentiment, not just underlying business performance. By comparing earnings per share (EPS) and share price changes over time, we can get a feel for how investor attitudes to a company have morphed over time.
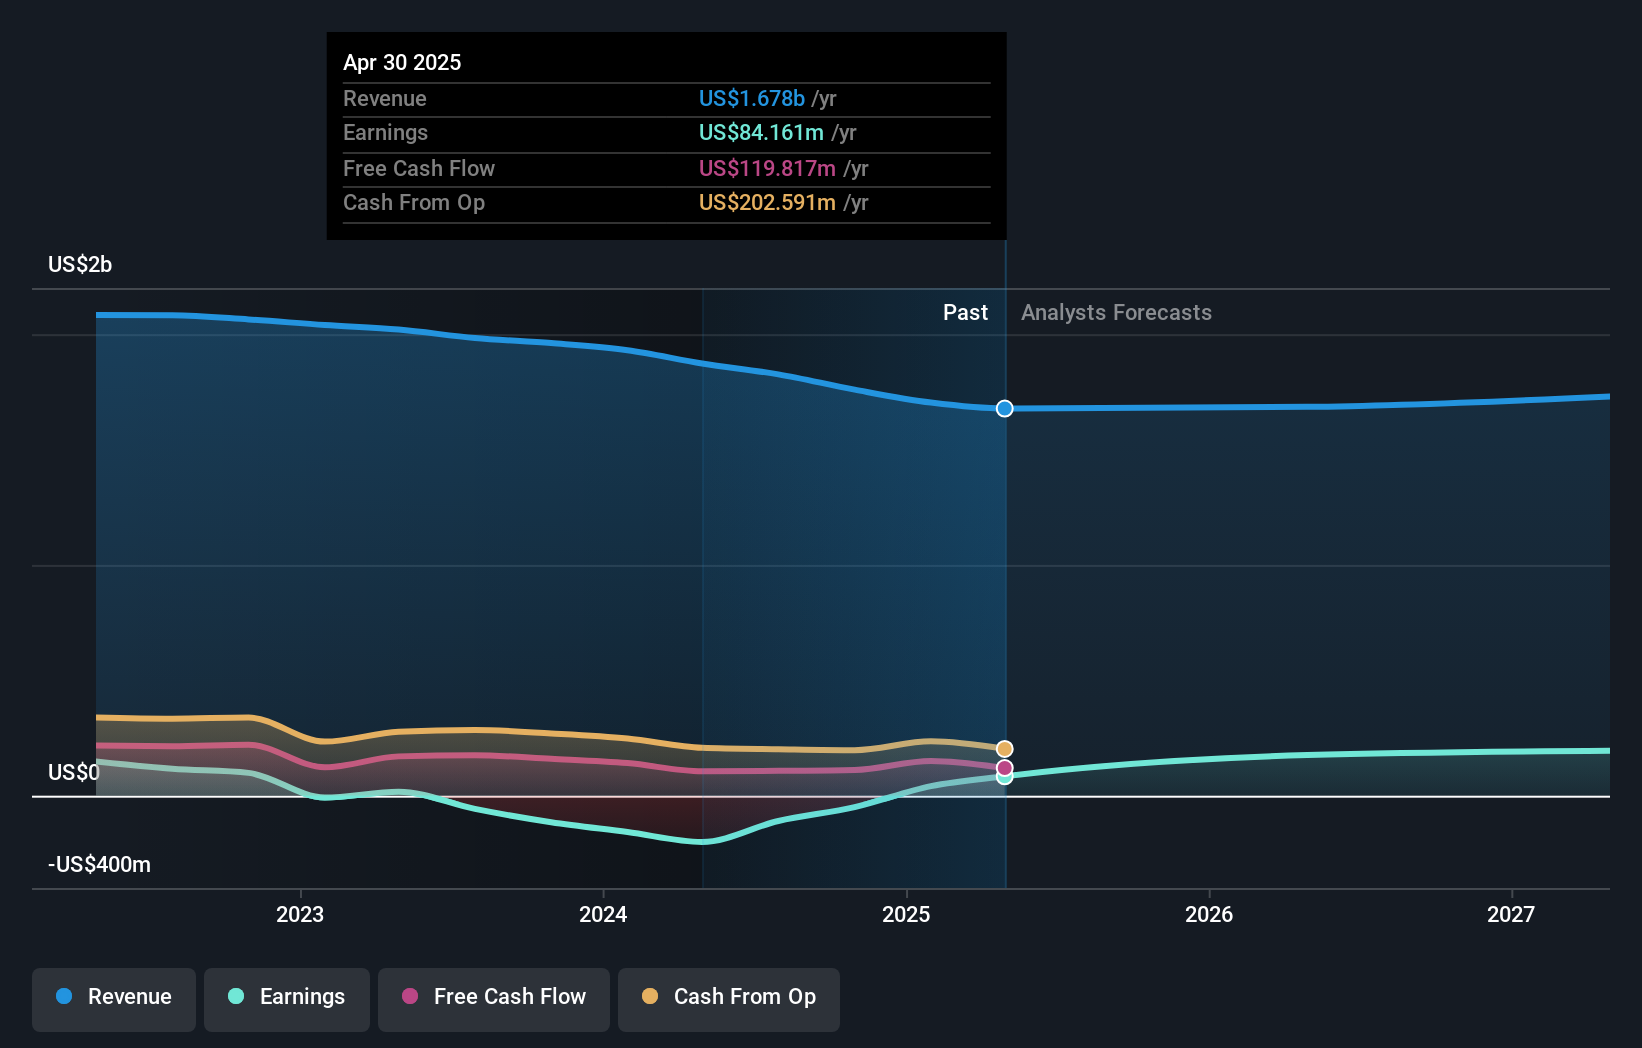
John Wiley & Sons became profitable within the last five years. That would generally be considered a positive, so we are surprised to see the share price is down. So given the share price is down it's worth checking some other metrics too.
We think that the revenue decline over three years, at a rate of 7.5% per year, probably had some shareholders looking to sell. And that's not surprising, since it seems unlikely that EPS growth can continue for long in the absence of revenue growth.
The company's revenue and earnings (over time) are depicted in the image below (click to see the exact numbers).
We know that John Wiley & Sons has improved its bottom line lately, but what does the future have in store? So we recommend checking out this free report showing consensus forecasts
What About Dividends?
It is important to consider the total shareholder return, as well as the share price return, for any given stock. The TSR incorporates the value of any spin-offs or discounted capital raisings, along with any dividends, based on the assumption that the dividends are reinvested. Arguably, the TSR gives a more comprehensive picture of the return generated by a stock. We note that for John Wiley & Sons the TSR over the last 3 years was -18%, which is better than the share price return mentioned above. And there's no prize for guessing that the dividend payments largely explain the divergence!
A Different Perspective
John Wiley & Sons shareholders are down 14% for the year (even including dividends), but the market itself is up 19%. Even the share prices of good stocks drop sometimes, but we want to see improvements in the fundamental metrics of a business, before getting too interested. Longer term investors wouldn't be so upset, since they would have made 6%, each year, over five years. If the fundamental data continues to indicate long term sustainable growth, the current sell-off could be an opportunity worth considering. I find it very interesting to look at share price over the long term as a proxy for business performance. But to truly gain insight, we need to consider other information, too. To that end, you should be aware of the 4 warning signs we've spotted with John Wiley & Sons .
If you are like me, then you will not want to miss this free list of undervalued small caps that insiders are buying.
Please note, the market returns quoted in this article reflect the market weighted average returns of stocks that currently trade on American exchanges.
New: Manage All Your Stock Portfolios in One Place
We've created the ultimate portfolio companion for stock investors, and it's free.
• Connect an unlimited number of Portfolios and see your total in one currency• Be alerted to new Warning Signs or Risks via email or mobile• Track the Fair Value of your stocks
Try a Demo Portfolio for FreeHave feedback on this article? Concerned about the content? Get in touch with us directly. Alternatively, email editorial-team (at) simplywallst.com.This article by Simply Wall St is general in nature. We provide commentary based on historical data and analyst forecasts only using an unbiased methodology and our articles are not intended to be financial advice. It does not constitute a recommendation to buy or sell any stock, and does not take account of your objectives, or your financial situation. We aim to bring you long-term focused analysis driven by fundamental data. Note that our analysis may not factor in the latest price-sensitive company announcements or qualitative material. Simply Wall St has no position in any stocks mentioned.
免責聲明:投資有風險,本文並非投資建議,以上內容不應被視為任何金融產品的購買或出售要約、建議或邀請,作者或其他用戶的任何相關討論、評論或帖子也不應被視為此類內容。本文僅供一般參考,不考慮您的個人投資目標、財務狀況或需求。TTM對信息的準確性和完整性不承擔任何責任或保證,投資者應自行研究並在投資前尋求專業建議。
熱議股票
- 1
- 2
- 3
- 4
- 5
- 6
- 7
- 8
- 9
- 10