Additional Considerations Required While Assessing Amazon.com's (NASDAQ:AMZN) Strong Earnings
Despite announcing strong earnings, Amazon.com, Inc.'s (NASDAQ:AMZN) stock was sluggish. We think that the market might be paying attention to some underlying factors that they find to be concerning.
AI is about to change healthcare. These 20 stocks are working on everything from early diagnostics to drug discovery. The best part - they are all under $10bn in marketcap - there is still time to get in early.
A Closer Look At Amazon.com's Earnings
One key financial ratio used to measure how well a company converts its profit to free cash flow (FCF) is the accrual ratio. To get the accrual ratio we first subtract FCF from profit for a period, and then divide that number by the average operating assets for the period. You could think of the accrual ratio from cashflow as the 'non-FCF profit ratio'.
That means a negative accrual ratio is a good thing, because it shows that the company is bringing in more free cash flow than its profit would suggest. That is not intended to imply we should worry about a positive accrual ratio, but it's worth noting where the accrual ratio is rather high. Notably, there is some academic evidence that suggests that a high accrual ratio is a bad sign for near-term profits, generally speaking.
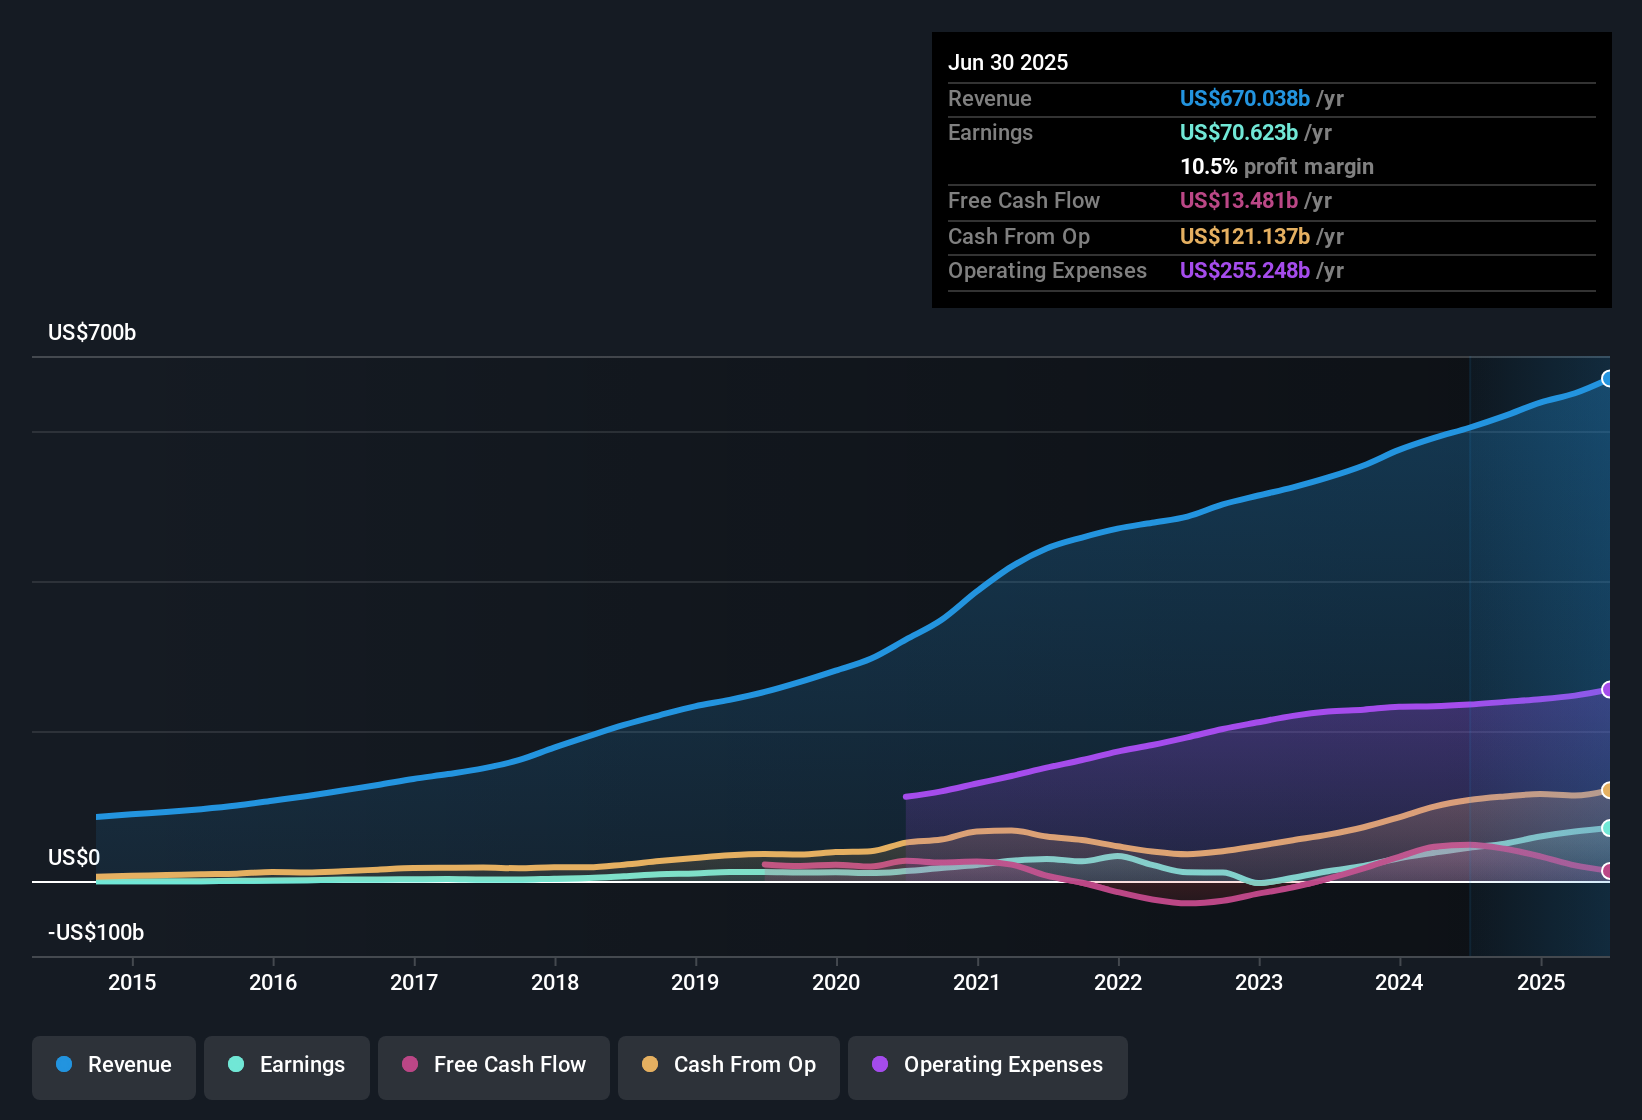
Over the twelve months to June 2025, Amazon.com recorded an accrual ratio of 0.22. Unfortunately, that means its free cash flow fell significantly short of its reported profits. In fact, it had free cash flow of US$13b in the last year, which was a lot less than its statutory profit of US$70.6b. Amazon.com shareholders will no doubt be hoping that its free cash flow bounces back next year, since it was down over the last twelve months. The good news for shareholders is that Amazon.com's accrual ratio was much better last year, so this year's poor reading might simply be a case of a short term mismatch between profit and FCF. As a result, some shareholders may be looking for stronger cash conversion in the current year.
That might leave you wondering what analysts are forecasting in terms of future profitability. Luckily, you can click here to see an interactive graph depicting future profitability, based on their estimates.
Our Take On Amazon.com's Profit Performance
Amazon.com's accrual ratio for the last twelve months signifies cash conversion is less than ideal, which is a negative when it comes to our view of its earnings. Because of this, we think that it may be that Amazon.com's statutory profits are better than its underlying earnings power. But the good news is that its EPS growth over the last three years has been very impressive. The goal of this article has been to assess how well we can rely on the statutory earnings to reflect the company's potential, but there is plenty more to consider. If you want to do dive deeper into Amazon.com, you'd also look into what risks it is currently facing. Every company has risks, and we've spotted 1 warning sign for Amazon.com you should know about.
Today we've zoomed in on a single data point to better understand the nature of Amazon.com's profit. But there are plenty of other ways to inform your opinion of a company. For example, many people consider a high return on equity as an indication of favorable business economics, while others like to 'follow the money' and search out stocks that insiders are buying. So you may wish to see this free collection of companies boasting high return on equity, or this list of stocks with high insider ownership.
New: Manage All Your Stock Portfolios in One Place
We've created the ultimate portfolio companion for stock investors, and it's free.
• Connect an unlimited number of Portfolios and see your total in one currency• Be alerted to new Warning Signs or Risks via email or mobile• Track the Fair Value of your stocks
Try a Demo Portfolio for FreeHave feedback on this article? Concerned about the content? Get in touch with us directly. Alternatively, email editorial-team (at) simplywallst.com.This article by Simply Wall St is general in nature. We provide commentary based on historical data and analyst forecasts only using an unbiased methodology and our articles are not intended to be financial advice. It does not constitute a recommendation to buy or sell any stock, and does not take account of your objectives, or your financial situation. We aim to bring you long-term focused analysis driven by fundamental data. Note that our analysis may not factor in the latest price-sensitive company announcements or qualitative material. Simply Wall St has no position in any stocks mentioned.
免責聲明:投資有風險,本文並非投資建議,以上內容不應被視為任何金融產品的購買或出售要約、建議或邀請,作者或其他用戶的任何相關討論、評論或帖子也不應被視為此類內容。本文僅供一般參考,不考慮您的個人投資目標、財務狀況或需求。TTM對信息的準確性和完整性不承擔任何責任或保證,投資者應自行研究並在投資前尋求專業建議。
熱議股票
- 1
- 2
- 3
- 4
- 5
- 6
- 7
- 8
- 9
- 10