Bitcoin Price Eyes $125k as Citi Boosts S&P 500 forecast, fear and greed jumps
Bitcoin price staged a strong bullish breakout on Sunday and into Monday, flirting with its all-time high. Momentum may continue as the fear and greed index climbs and Citi analysts boost their stock forecast.
- Bitcoin price is targeting $125,000 as Citi boosts its S&P 500 Index forecast.
- The analyst cited the strong quarterly earnings and tax cuts.
- The crypto fear and greed index has jumped to the greed zone.
Bitcoin (BTC) jumped to a multi-week high of $122,230, much higher than last week’s low of $112,000. It was up by 65% between its lowest level in April and its highest point on Monday, Aug. 11.
Citi analysts boost S&P 500 target as fear and greed rises
A potential catalyst for Bitcoin price is the broader risk-on sentiment as the S&P 500 and Nasdaq 100 hit record highs.
Wall Street analysts have begun raising targets. On Monday, Citi analysts boosted their S&P 500 estimate to 6,600 from 6,300, citing the recent tax cuts in the Big Beautiful Bill, which they believe will offset tariff impacts.
They also highlighted a better-than-expected earnings season, with companies reporting an average 10% earnings growth. According to FactSet, this was the third straight quarter of double-digit growth, with 81% of firms beating expectations.
Bitcoin price may also rally as the crypto fear and greed index moved to the greed zone of 62. It has jumped from this month’s low of 53, confirming that a risk-on sentiment is spreading in the market.
Additionally, American investors continue to accumulate Bitcoin ETFs. Spot Bitcoin ETFs added over $403 million in assets on Friday after adding $280 million on the previous day. These funds have had net inflows of $54.4 billion since their inception.
The next key catalyst for BTC price was the upcoming US consumer inflation report on Tuesday. The average estimate among investors is that the CPI rose slightly to 2.8% in July. A lower-than-expected figure will boost Bitcoin by raising the odds of Federal Reserve cuts.
Bitcoin price technical analysis
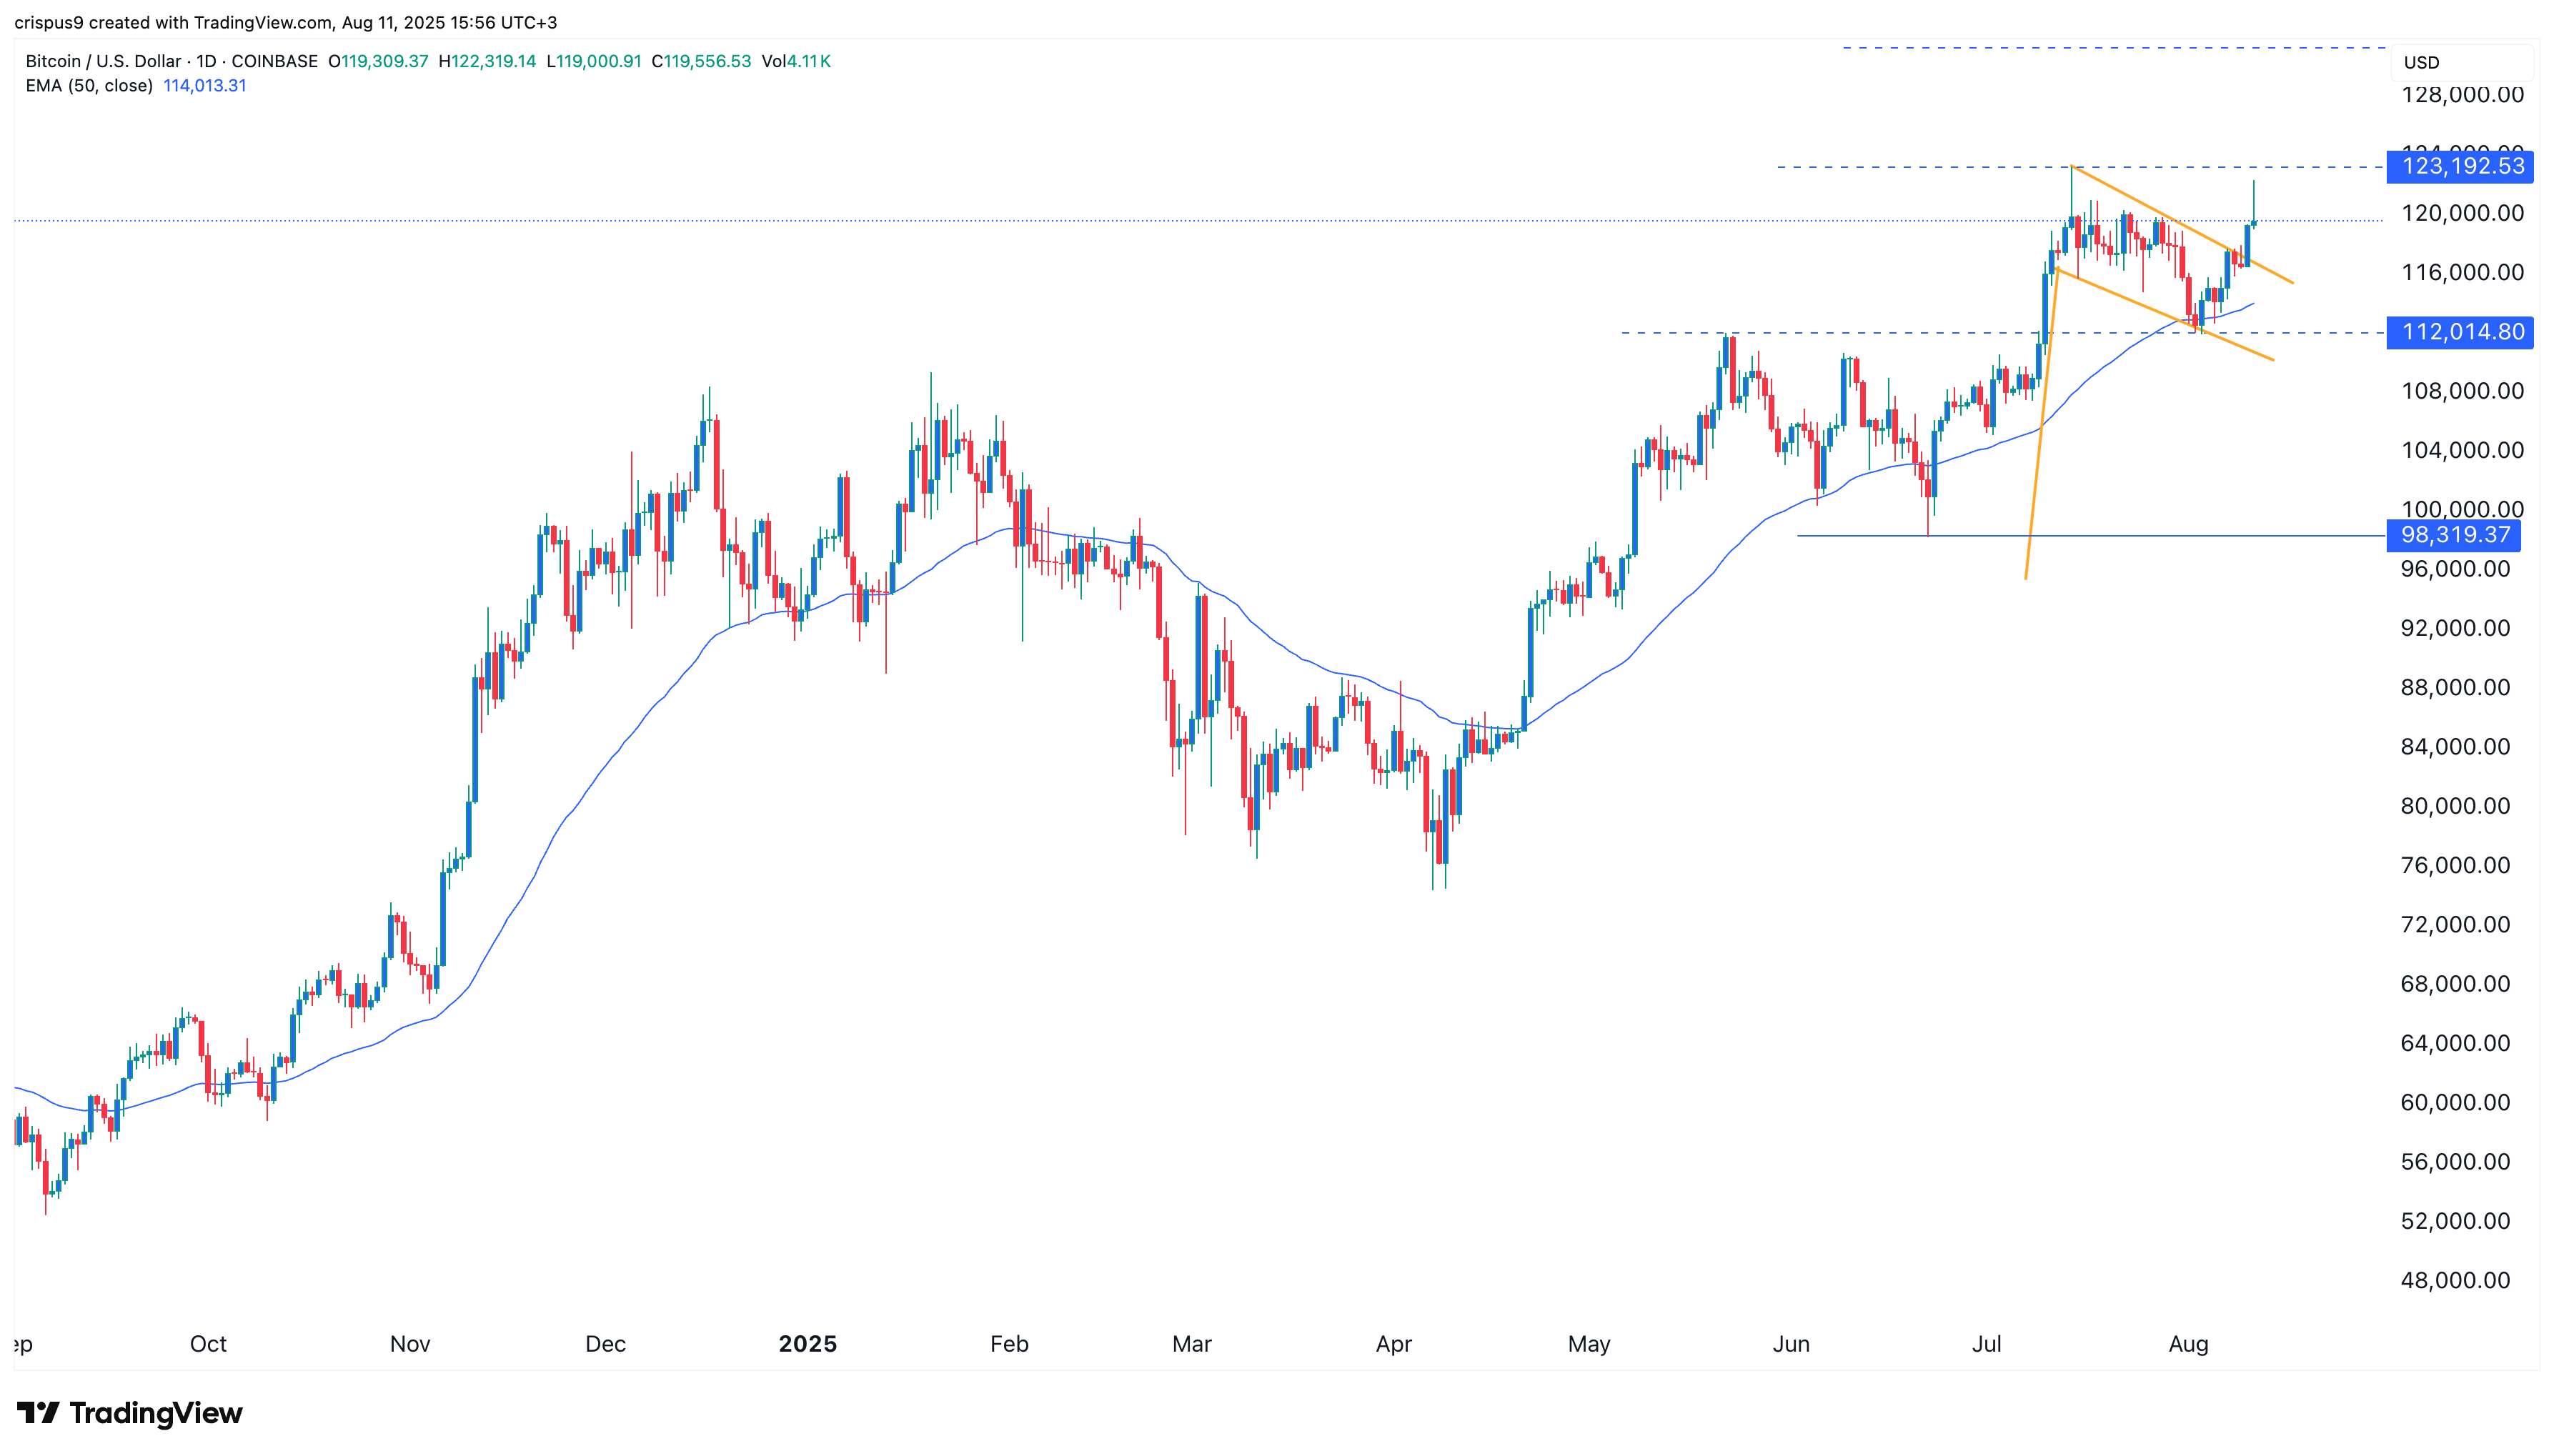
The daily chart shows a bullish setup, with BTC breaking above the upper side of a descending channel that forms part of a bullish flag pattern.
The price remains above both the 50-day and 100-day moving averages and is approaching the all-time high of $123,200. The most likely scenario is a break above this level, flipping it into support and targeting a new all-time high at $125,000.
免責聲明:投資有風險,本文並非投資建議,以上內容不應被視為任何金融產品的購買或出售要約、建議或邀請,作者或其他用戶的任何相關討論、評論或帖子也不應被視為此類內容。本文僅供一般參考,不考慮您的個人投資目標、財務狀況或需求。TTM對信息的準確性和完整性不承擔任何責任或保證,投資者應自行研究並在投資前尋求專業建議。
熱議股票
- 1
- 2
- 3
- 4
- 5
- 6
- 7
- 8
- 9
- 10