Is General Dynamics Corporation's (NYSE:GD) Recent Stock Performance Influenced By Its Fundamentals In Any Way?
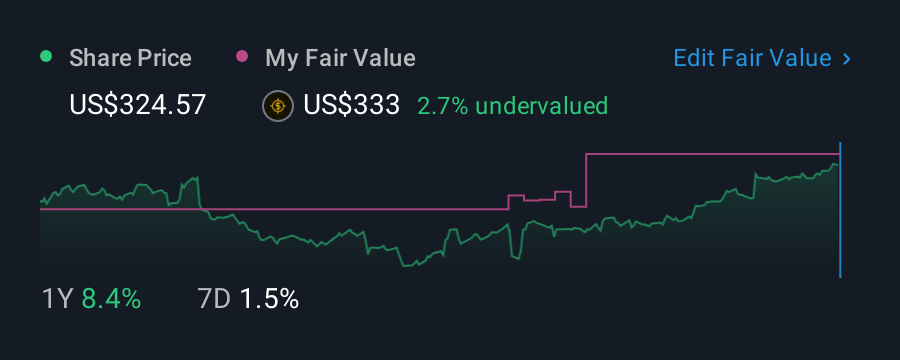
General Dynamics (NYSE:GD) has had a great run on the share market with its stock up by a significant 11% over the last three months. We wonder if and what role the company's financials play in that price change as a company's long-term fundamentals usually dictate market outcomes. In this article, we decided to focus on General Dynamics' ROE.
Return on equity or ROE is an important factor to be considered by a shareholder because it tells them how effectively their capital is being reinvested. In other words, it is a profitability ratio which measures the rate of return on the capital provided by the company's shareholders.
We've found 21 US stocks that are forecast to pay a dividend yield of over 6% next year. See the full list for free.
How To Calculate Return On Equity?
Return on equity can be calculated by using the formula:
Return on Equity = Net Profit (from continuing operations) ÷ Shareholders' Equity
So, based on the above formula, the ROE for General Dynamics is:
17% = US$4.1b ÷ US$24b (Based on the trailing twelve months to June 2025).
The 'return' is the amount earned after tax over the last twelve months. So, this means that for every $1 of its shareholder's investments, the company generates a profit of $0.17.
View our latest analysis for General Dynamics
Why Is ROE Important For Earnings Growth?
We have already established that ROE serves as an efficient profit-generating gauge for a company's future earnings. Based on how much of its profits the company chooses to reinvest or "retain", we are then able to evaluate a company's future ability to generate profits. Assuming all else is equal, companies that have both a higher return on equity and higher profit retention are usually the ones that have a higher growth rate when compared to companies that don't have the same features.
General Dynamics' Earnings Growth And 17% ROE
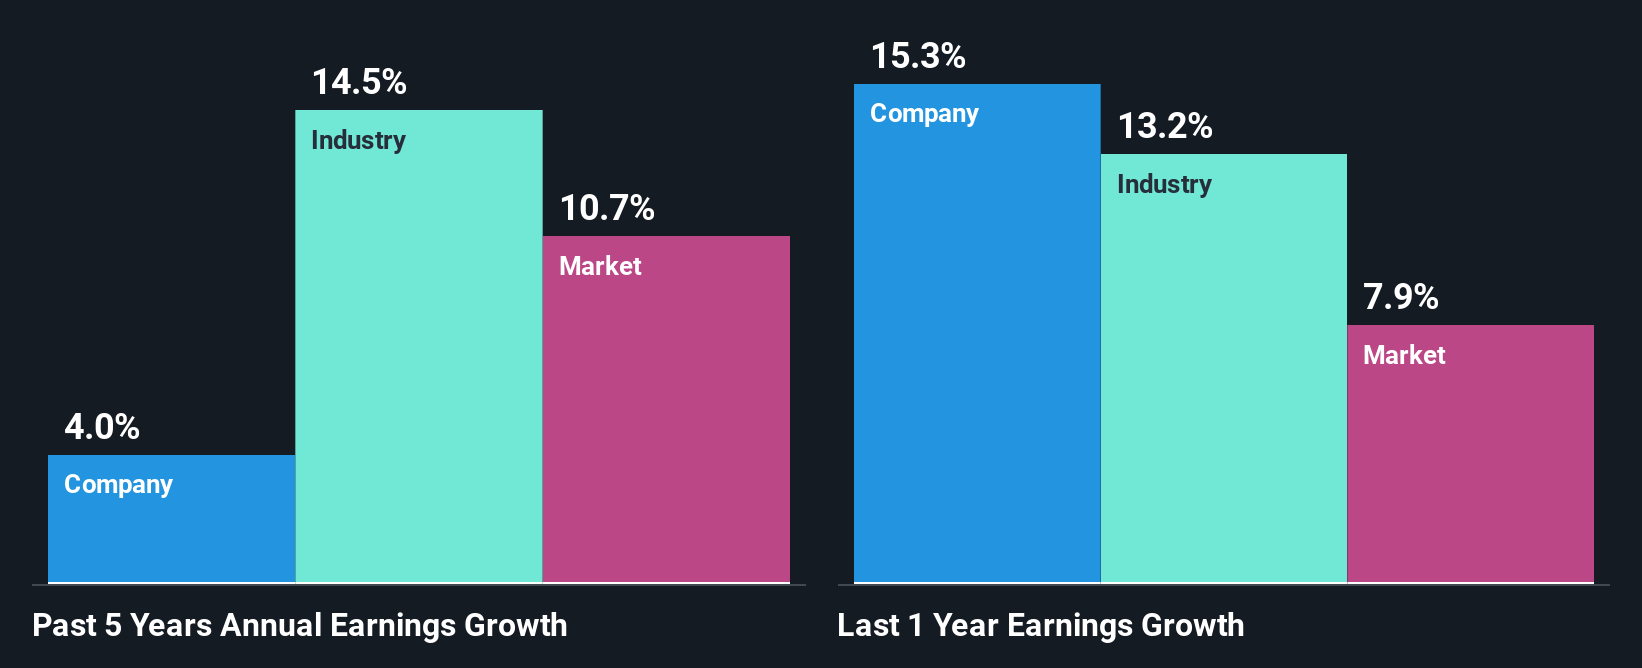
To begin with, General Dynamics seems to have a respectable ROE. On comparing with the average industry ROE of 11% the company's ROE looks pretty remarkable. Despite this, General Dynamics' five year net income growth was quite low averaging at only 4.0%. This is generally not the case as when a company has a high rate of return it should usually also have a high earnings growth rate. A few likely reasons why this could happen is that the company could have a high payout ratio or the business has allocated capital poorly, for instance.
Next, on comparing with the industry net income growth, we found that General Dynamics' reported growth was lower than the industry growth of 15% over the last few years, which is not something we like to see.
Earnings growth is an important metric to consider when valuing a stock. The investor should try to establish if the expected growth or decline in earnings, whichever the case may be, is priced in. This then helps them determine if the stock is placed for a bright or bleak future. Has the market priced in the future outlook for GD? You can find out in our latest intrinsic value infographic research report.
Is General Dynamics Using Its Retained Earnings Effectively?
While General Dynamics has a decent three-year median payout ratio of 41% (or a retention ratio of 59%), it has seen very little growth in earnings. So there could be some other explanation in that regard. For instance, the company's business may be deteriorating.
In addition, General Dynamics has been paying dividends over a period of at least ten years suggesting that keeping up dividend payments is way more important to the management even if it comes at the cost of business growth. Our latest analyst data shows that the future payout ratio of the company over the next three years is expected to be approximately 37%. Accordingly, forecasts suggest that General Dynamics' future ROE will be 19% which is again, similar to the current ROE.
Summary
On the whole, we do feel that General Dynamics has some positive attributes. However, given the high ROE and high profit retention, we would expect the company to be delivering strong earnings growth, but that isn't the case here. This suggests that there might be some external threat to the business, that's hampering its growth. Having said that, looking at the current analyst estimates, we found that the company's earnings are expected to gain momentum. To know more about the company's future earnings growth forecasts take a look at this free report on analyst forecasts for the company to find out more.
New: Manage All Your Stock Portfolios in One Place
We've created the ultimate portfolio companion for stock investors, and it's free.
• Connect an unlimited number of Portfolios and see your total in one currency• Be alerted to new Warning Signs or Risks via email or mobile• Track the Fair Value of your stocks
Try a Demo Portfolio for FreeHave feedback on this article? Concerned about the content? Get in touch with us directly. Alternatively, email editorial-team (at) simplywallst.com.This article by Simply Wall St is general in nature. We provide commentary based on historical data and analyst forecasts only using an unbiased methodology and our articles are not intended to be financial advice. It does not constitute a recommendation to buy or sell any stock, and does not take account of your objectives, or your financial situation. We aim to bring you long-term focused analysis driven by fundamental data. Note that our analysis may not factor in the latest price-sensitive company announcements or qualitative material. Simply Wall St has no position in any stocks mentioned.
免責聲明:投資有風險,本文並非投資建議,以上內容不應被視為任何金融產品的購買或出售要約、建議或邀請,作者或其他用戶的任何相關討論、評論或帖子也不應被視為此類內容。本文僅供一般參考,不考慮您的個人投資目標、財務狀況或需求。TTM對信息的準確性和完整性不承擔任何責任或保證,投資者應自行研究並在投資前尋求專業建議。
熱議股票
- 1
- 2
- 3
- 4
- 5
- 6
- 7
- 8
- 9
- 10