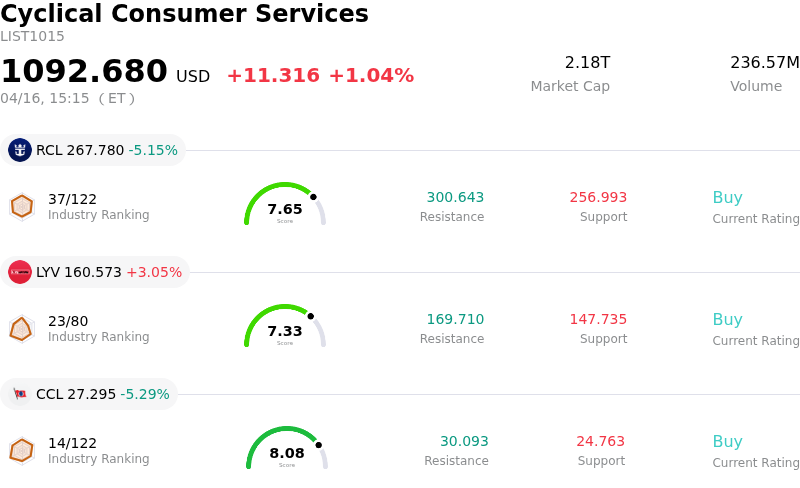
Royal Caribbean Cruises Ltd (RCL) moved down by 5.15%. The Cyclical Consumer Services sector is up by 1.04%. The company underperformed the industry. Top 3 stocks by turnover in the sector: Royal Caribbean Cruises Ltd (RCL) down 5.15%; Live Nation Entertainment Inc (LYV) up 3.05%; Carnival Corp (CCL) down 5.29%.
What is driving Royal Caribbean Cruises Ltd (RCL)’s stock price down today?
Royal Caribbean Group (RCL) experienced a notable decline in its share price today. This downturn appears to be largely influenced by a recent analyst downgrade related to its 2026 outlook for European cruise demand.
UBS, a prominent investment bank, lowered its 2026 yield growth forecast for Royal Caribbean to 1.5% from a previous 3%, citing weaker pricing and bookings specifically for Europe itineraries. The firm also reduced its price target for RCL from $350 to $321, attributing this adjustment to softening European demand. This change in outlook suggests that while overall demand for cruising remains robust, as indicated by recent industry reports showing record passenger volumes and high intent to re-sail, the geographic mix of demand or geopolitical factors might be shifting. Geopolitical tensions, for instance, have been cited as a reason for cooling North American demand for European sailings.
Despite this specific regional concern, the broader cruise industry outlook remains positive, with strong demand and significant new ship orders across major players, including Royal Caribbean. Royal Caribbean itself had previously issued strong 2026 earnings guidance earlier in the year, with projected adjusted EPS between $17.70 and $18.10, driven by double-digit revenue and EPS growth and higher capacity. However, the revised yield growth forecast for Europe indicates a potential headwind for achieving these aggressive targets if other regions cannot fully offset the softening.
It is worth noting that on the same day as the share price movement, Royal Caribbean Group announced the launch of the Royal Caribbean Group Foundation, formalizing its philanthropic arm. While this is a significant corporate event, it is typically not a direct driver of short-term stock price volatility in the way financial guidance or analyst revisions can be. Additionally, some analysts still maintain a "Buy" consensus rating on RCL, with an average price target that suggests potential upside, despite the recent adjustments. The stock had also seen a relief rally earlier in April following hopes of a ceasefire between the U.S. and Iran, which eased oil prices, a significant operating cost for cruise lines.
Technical Analysis of Royal Caribbean Cruises Ltd (RCL)
Technically, Royal Caribbean Cruises Ltd (RCL) shows a MACD (12,26,9) value of [-4.57], indicating a neutral signal. The RSI at 51.31 suggests neutral condition and the Williams %R at -50.61 suggests oversold condition. Please monitor closely.
Fundamental Analysis of Royal Caribbean Cruises Ltd (RCL)
Royal Caribbean Cruises Ltd (RCL) is in the Cyclical Consumer Services industry. Its latest annual revenue is $17.93B, ranking 7 in the industry. The net profit is $4.27B, ranking 4 in the industry. Company Profile
Over the past month, multiple analysts have rated the company as Buy, with an average price target of $344.05, a high of $425.00, and a low of $256.22.
More details about Royal Caribbean Cruises Ltd (RCL)
Company Specific Risks:
- Multiple institutional analysts have recently lowered price targets for RCL, citing concerns over softer European itinerary demand and higher fuel costs, indicating potential downward revisions to future earnings expectations.
- Significant open-market selling by key executives, with $0.58 billion in sales and no purchases in high-impact transactions over the last year, suggests a lack of insider confidence in the company's near-term prospects.
- Royal Caribbean Group continues to carry a high level of debt, which has increased by 6% year-over-year and 5% quarter-over-quarter, with debt being 120% higher than equity, signaling elevated financial leverage.
- The company's business model remains highly capital intensive, requiring ongoing significant capital expenditure and debt issuance (such as recent senior notes for refinancing), which can strain financial resources and limit flexibility.
Find out more