XRP (XRPUSD) is down 2.07% at Jul 8 00:05(ET), now at $1.0953, with a 7-day up of 3.52%.
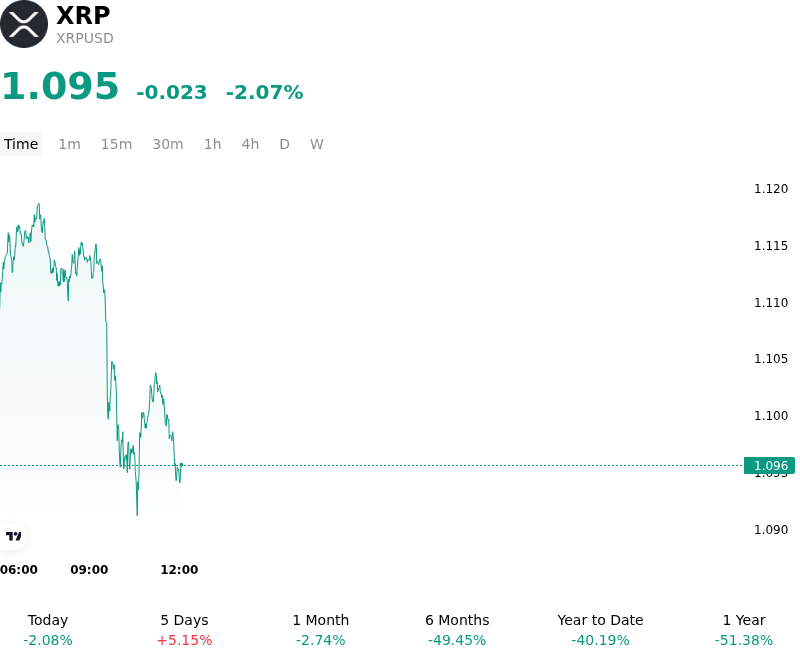
What is driving XRP (XRPUSD)’s stock price down today?
The intraday downward movement in XRPUSD reflects a combination of technical resistance, localized profit-taking, and a cooling of derivatives leverage, despite positive structural milestones. Although Ripple successfully secured a full Crypto Asset Service Provider license in Luxembourg under the European Union’s Markets in Crypto-Assets framework, the market treated the development as a sell-the-news event. This regulatory milestone provides long-term passporting rights across the European Economic Area, yet it failed to generate immediate buying pressure in a market increasingly focused on short-term liquidity rotations.
A primary driver of the decline was a persistent cooling in retail demand within the crypto derivatives market. XRP perpetual futures open interest fell steadily over the session, indicating a reduction in speculative leverage and long positioning. This deleveraging process has limited the asset's ability to sustain intraday rallies, as trading volume on spot exchanges was primarily dominated by sellers capitalizing on recent weekly gains rather than fresh capital entering the market.
Furthermore, capital flows within the broader digital asset space shifted toward highly volatile, lower-cap altcoins, pulling speculative liquidity away from established majors. While the top of the market remained relatively stable, mid-cap assets like XRP faced moderate distribution as traders rotated exposure. This structural rotation, combined with frustration over the delay of the legislative vote on the CLARITY Act, has weighed heavily on immediate investor sentiment.
Technically, XRP’s inability to break and hold above the crucial moving average cluster acting as immediate overhead resistance intensified technical selling. Faltering to reclaim key overhead levels triggered automated stop-losses and liquidated late-entering long positions, compounding the downside momentum. Despite robust underlying fundamentals, including persistent multi-week inflows into spot XRP exchange-traded funds, the short-term market structure remains constrained by fading speculative momentum and a macro environment that favors cautious positioning ahead of key central bank updates.
Technical Analysis of XRP (XRPUSD)
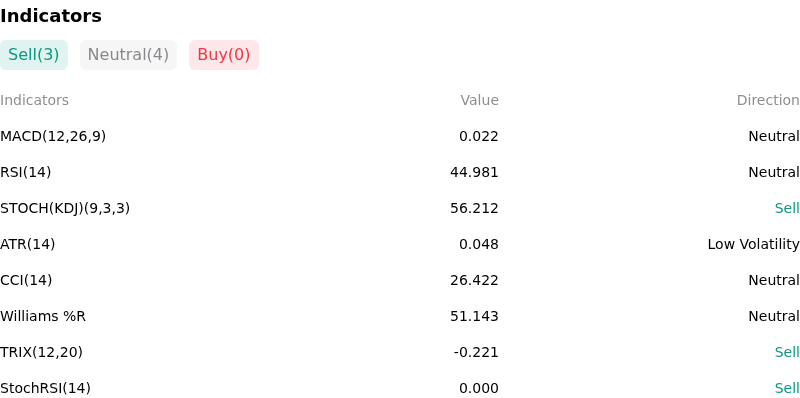
Technically, XRP (XRPUSD) shows a MACD (12,26,9) value of 0.022, indicating a neutral signal. The RSI at 44.981 suggests neutral condition and the Williams %R at 51.143 suggests neutral condition. Please monitor closely.
More details about XRP (XRPUSD)
Recent Events and Risks:
- "Sell-the-News" Behavior Post-MiCA Licensing: Despite Ripple securing a full Crypto-Asset Service Provider (CASP) license from Luxembourg’s CSSF under Europe’s MiCA framework, the market has processed this as a company-level milestone rather than a direct value-accruing catalyst for the native token. This has triggered immediate "sell-the-news" profit-taking, dragging XRP down from its recent high of $1.18 toward $1.13.
- Decreasing Legislative Passage Odds for the CLARITY Act: XRP’s mid-term regulatory outlook remains highly dependent on the passage of the U.S. CLARITY Act. Projections indicating that a Senate floor vote is likely to slip past initial targets into late summer or fall have introduced significant execution risk, with research groups reducing the projected 2026 passage odds of the bill down to 50%.
- Cooling Derivatives Interest and Retail Exhaustion: Subdued retail demand is weighing heavily on market structure. XRP perpetual futures Open Interest (OI) has steadily cooled to $2.38 billion, representing a massive decline from previous peaks and signaling a withdrawal of speculative capital and persistent investor fatigue.
- Technical Resistance Clusters and Liquidation Risks: XRP faces formidable overhead supply walls and trapped cost-basis clusters concentrated between $1.15 and $1.20. Technical analysts warn that failure to reclaim these key levels risks a bearish rejection back toward the psychological $1.00 support floor, which, if breached, could trigger a cascading stop-loss unwind down to the $0.80–$0.85 demand zone.
Find out more