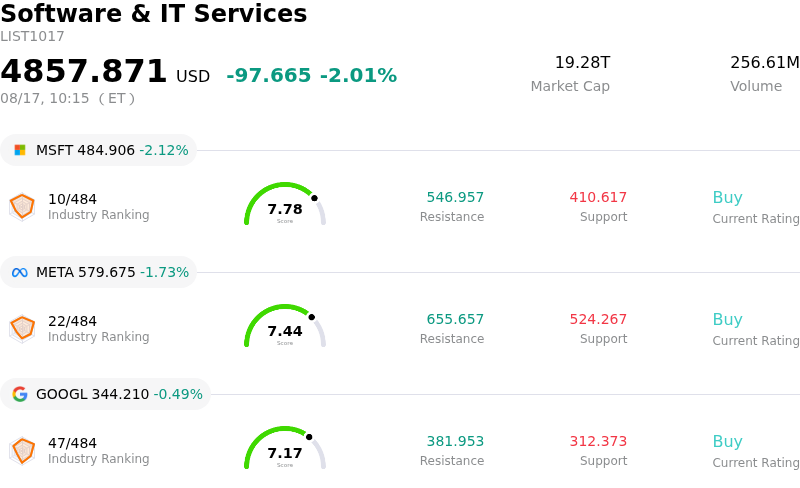
ServiceNow Inc (NOW) moved down by 3.05%. The Software & IT Services sector is down by 2.01%. The company underperformed the industry. Top 3 stocks by turnover in the sector: Microsoft Corp (MSFT) down 2.18%; Meta Platforms Inc (META) down 1.73%; Alphabet Inc Class A (GOOGL) down 0.49%.
What is driving ServiceNow Inc (NOW)’s stock price down today?
ServiceNow experienced downward pressure and heightened intraday volatility as profit-taking and sector-wide recalibration weighed on high-valuation enterprise software stocks. After a strong run-up in previous weeks, investors seized the opportunity to lock in gains amidst broader macro uncertainty and shifting risk appetite within the technology space. Shares with premium price-to-earnings multiples faced heightened sensitivity, making enterprise SaaS leaders particularly vulnerable to intraday swings when market sentiment cools.
Underpinning the selling pressure are persistent questions regarding artificial intelligence competition and cost structures. Although ServiceNow delivered solid subscription growth in its recent quarterly report and modestly raised its full-year revenue outlook, recent downward revisions in near-term consensus earnings per share estimates have created friction among institutional investors. Accelerating investments in generative AI capabilities, autonomous security suites, and global footprint expansion have bolstered the long-term strategic narrative, but they also introduce short-term margin compression that keeps valuation expansion in check.
Furthermore, the competitive dynamic in enterprise automation remains a central focus for market participants. Traditional cloud software platforms face ongoing scrutiny over potential disruption from AI-native startups and aggressive product expansions by mega-cap software peers. While ServiceNow continues to expand its agentic AI deployments and strengthen core enterprise workflows, high expectations leave little room for execution pauses. Today's movement reflects a broader market digest of these valuation and margin trade-offs rather than a fundamental operational deterioration.
Technical Analysis of ServiceNow Inc (NOW)
Technically, ServiceNow Inc (NOW) shows a MACD (12,26,9) value of 2.470, indicating a buy signal. The RSI at 61.716 suggests neutral condition and the Williams %R at 24.262 suggests buy condition. Please monitor closely.
Media Coverage of ServiceNow Inc (NOW)
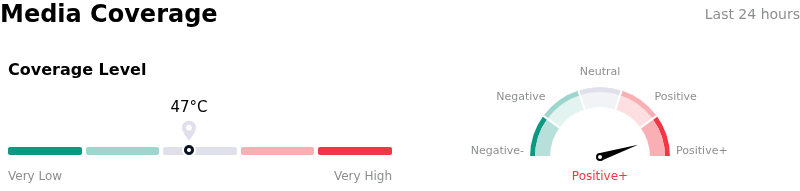
In terms of media coverage, ServiceNow Inc (NOW) shows a coverage score of 47, indicating a moderate level of media attention. The overall market sentiment index is currently in extremely bullish zone.
Fundamental Analysis of ServiceNow Inc (NOW)
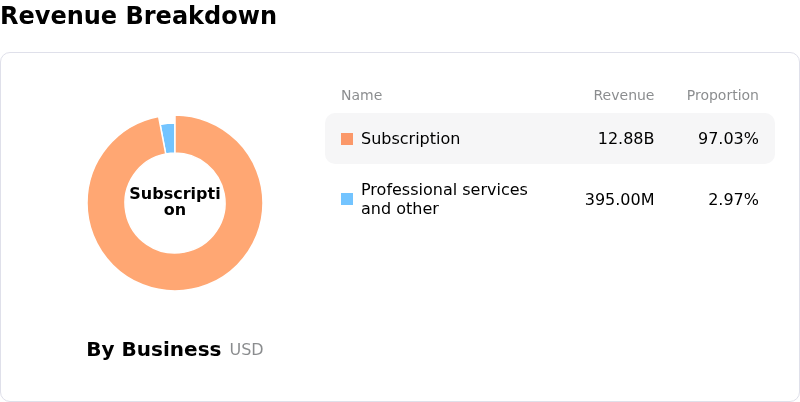
ServiceNow Inc (NOW) is in the Software & IT Services industry. Its latest annual revenue is $13.28B, ranking 28 in the industry. The net profit is $1.75B, ranking 30 in the industry. Company Profile
Over the past month, multiple analysts have rated the company as Buy, with an average price target of $144.24, a high of $248.00, and a low of $72.00.
More details about ServiceNow Inc (NOW)
Company Specific Risks:
- Elevated Valuation and Downward EPS Revisions: Trading at a premium valuation exceeding 77x earnings, ServiceNow faces risk of price-multiple compression as Wall Street analysts have consistently revised 2026 EPS consensus estimates downward over the past month, magnifying intraday sell-offs when broad enterprise software sentiment dips.
- Margin Pressure from Intensified AI Investments: Profitability continues to experience short-term margin friction as management ramps up capital expenditures and operational spend on AI architecture and cybersecurity initiatives, creating profitability headwinds despite ongoing subscription revenue expansion.
- Competitive Threats from AI-Native Solutions: ServiceNow faces intensifying competition from tech peers such as Microsoft, Salesforce, and Oracle, alongside emerging AI-native workflow automation platforms, raising concerns over long-term market share retention and enterprise contract renewal pricing power.
- Balance Sheet Leverage and M&A Integration Risk: Large-scale capital commitments, led by the $7.75 billion cash acquisition of cybersecurity firm Armis and backed by a $4 billion senior debt issuance, expose the company to execution, integration, and heightened interest coverage risks amidst market volatility.
Find out more