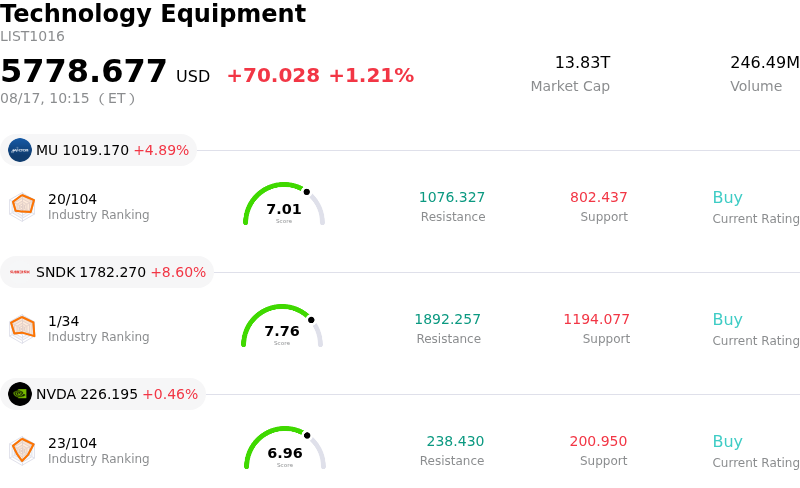
Applied Materials Inc (AMAT) moved up by 5.09%. The Technology Equipment sector is up by 1.21%. The company outperformed the industry. Top 3 stocks by turnover in the sector: Micron Technology Inc (MU) up 4.89%; SanDisk Corporation (SNDK) up 8.18%; NVIDIA Corp (NVDA) up 0.46%.
What is driving Applied Materials Inc (AMAT)’s stock price up today?
Applied Materials experienced a strong upward surge following a sharp, short-term sell-off triggered by its fiscal third-quarter earnings release. Market sentiment quickly turned positive as investors and institutional buyers stepped in to buy the dip, recognizing that the previous session's drop was driven by profit-taking and elevated market expectations rather than fundamental weakness. Reaffirming buy recommendations and elevated target prices, Wall Street analysts emphasized that the company's operational trajectory remains exceptionally robust, propelled by multi-year artificial intelligence infrastructure tailwinds.
The rally was further supported by the company's stellar fiscal third-quarter financial performance and raised forward guidance. Applied Materials delivered record quarterly revenue and adjusted earnings per share, beating consensus estimates. Strong demand across leading-edge foundry-logic, DRAM memory, and advanced packaging equipment underscored the ongoing global buildout of high-performance computing capabilities. Looking into the fourth quarter, management guided revenue and earnings well above expectations, projecting substantial year-over-year top-line expansion as semiconductor fabricators accelerate installation schedules.
Institutional sentiment stabilized as investors re-evaluated management's multi-year growth commentary and customer visibility extending toward the end of the decade. Advanced packaging revenues are expected to expand dramatically this calendar year, while expanded long-term agreements reinforce confidence in Applied Materials outperforming the overall wafer fab equipment market. The post-earnings volatility served as a valuation reset, allowing market participants to re-engage with a core beneficiary of global chipmaking expansion.
Technical Analysis of Applied Materials Inc (AMAT)
Technically, Applied Materials Inc (AMAT) shows a MACD (12,26,9) value of 2.947, indicating a neutral signal. The RSI at 44.942 suggests neutral condition and the Williams %R at 44.399 suggests buy condition. Please monitor closely.
Media Coverage of Applied Materials Inc (AMAT)
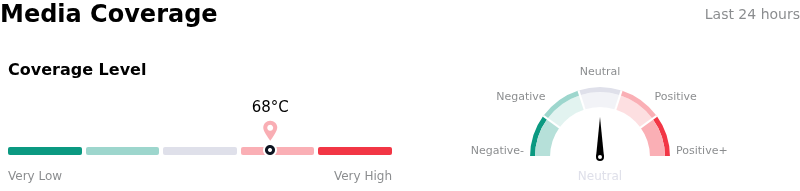
In terms of media coverage, Applied Materials Inc (AMAT) shows a coverage score of 68, indicating a high level of media attention. The overall market sentiment index is currently in neutral zone.
Fundamental Analysis of Applied Materials Inc (AMAT)
Applied Materials Inc (AMAT) is in the Technology Equipment industry. Its latest annual revenue is $28.37B, ranking 11 in the industry. The net profit is $7.00B, ranking 8 in the industry. Company Profile
Over the past month, multiple analysts have rated the company as Buy, with an average price target of $629.01, a high of $900.00, and a low of $308.00.
More details about Applied Materials Inc (AMAT)
Company Specific Risks:
- Flat Gross Margin Outlook Limits Operating Leverage: Despite guiding fiscal Q4 2026 revenue to a record $10.25 billion following its Q3 earnings release, Applied Materials projected flat quarter-over-quarter gross margins of 50.4%. Institutional analysts noted that accelerated capacity expansion and aggressive hiring expenses are capping near-term profit expansion, leaving the stock in a "show-me" story for operating leverage.
- Narrowing Market Outgrowth vs. SPE Peers: Sell-side research highlighted that AMAT's systems shipment growth forecast was reduced from 44% to 42%, narrowing its relative outgrowth margin above overall Wafer Fab Equipment (WFE) spend. The distinction between AMAT's performance and standout prints from specialized semiconductor equipment peers led to price target trims from major brokerages.
- Shrinking Revenue Mix from China: Earnings disclosures revealed that revenue from China continued to contract as a percentage of total corporate sales mix. Continued geopolitical trade friction and shifting foreign customer capital expenditure allocations introduce ongoing revenue headwind risks.
- Elevated Valuation Multiple and Pre-Earnings Executive Selling: Trading at roughly 49.5 times trailing earnings after doubling year-to-date, the stock walked into earnings priced for perfection. Corporate insiders sold over $169.7 million in stock across 278,088 shares over the preceding 90 days with zero insider buys, signaling heightened downside sensitivity to any positioning reset.
Find out more