Solana (SOLUSD) is up 1.88% at Aug 21 00:10(ET), now at $88.22, with a 7-day up of 18.98%.
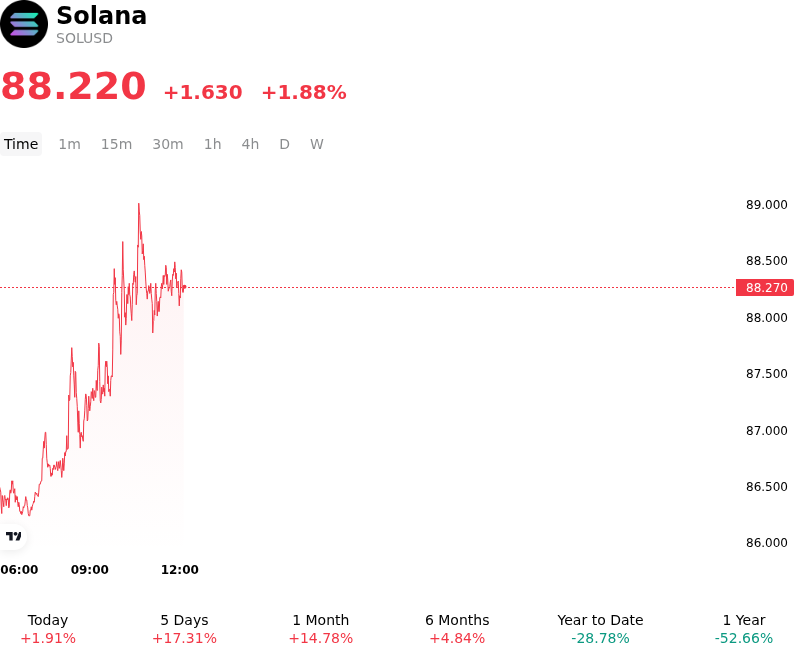
What is driving Solana (SOLUSD)’s stock price up today?
Solana advanced as capital responded positively to a landmark protocol upgrade that improved core network infrastructure and heightened long-term adoption expectations. The activation of the Agave release reduced the target slot time from 400 milliseconds to 350 milliseconds, marking the first reduction in block cadence since the network's inception. This throughput enhancement directly benefits high-frequency decentralized finance applications, decentralized exchange execution, and real-world asset settlement by lowering transaction latency. The successful mainnet deployment strengthened institutional confidence in Solana's multi-stage engineering roadmap toward sub-200 millisecond execution and future consensus optimizations.
The token's upside momentum was further reinforced by favorable macroeconomic liquidity conditions and steady capital inflows into regulated investment vehicles. A decline in U.S. Treasury yields and moderate weakness in the U.S. dollar provided a supportive macro backdrop for digital assets, reviving risk appetite across high-beta smart contract platforms. Simultaneously, spot Solana exchange-traded products continued to capture consistent net institutional inflows, underscoring expanding institutional participation and corporate treasury allocations. Elevated network activity across decentralized trading venues and automated market makers sustained high transaction volume, providing underlying structural demand.
In the derivatives market, the upward movement triggered secondary short covering, reducing bearish exposure and accelerating spot market buying pressure. Positive futures funding rates reflected constructive sentiment among market participants, while open interest expanded across major trading venues without elevating leverage to systemic risk levels. The price action reflects a structural repricing driven by tangible protocol performance, institutional adoption through exchange-traded products, and broader market liquidity expansion. Investors continue to monitor global macroeconomic policy, regulatory progress regarding digital asset market structure, and ongoing validator performance as higher block execution cadences take effect.
Technical Analysis of Solana (SOLUSD)
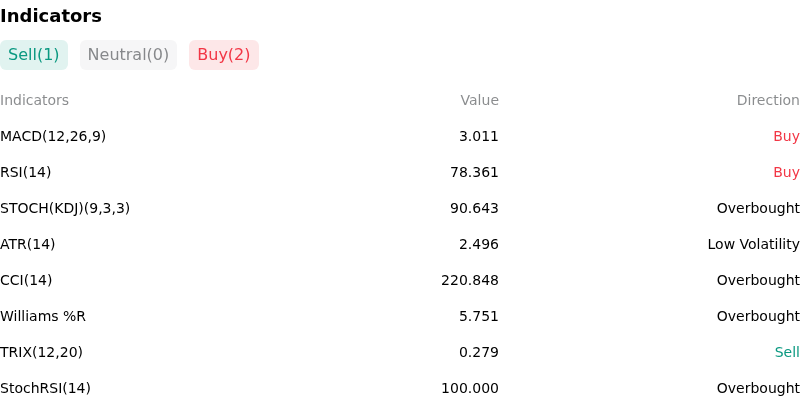
Technically, Solana (SOLUSD) shows a MACD (12,26,9) value of 3.003, indicating a buy signal. The RSI at 78.301 suggests buy condition and the Williams %R at 6.114 suggests overbought condition. Please monitor closely.
More details about Solana (SOLUSD)
Recent Events and Risks:
- Elevated Futures Leverage and Resistance Rejection Risk: Derivatives data indicates a sharp surge in futures open interest toward $5.66 billion alongside high long positioning as SOL trades near critical overhead resistance around $80–$83. A failure to solidify support above this level leaves the market vulnerable to heavy long liquidation cascades and a rapid pullback toward $70–$72.
- Spot ETF Demand Stagnation and Flow Divergence: Institutional spot SOL ETF inflows have slowed down significantly with multiple zero-inflow trading sessions and periodic daily net outflows. The widening gap between cumulative ETF net inflows ($1.12B+) and total assets under management (~$725M) reflects underlying asset depreciation, leaving the market exposed if institutional buying fails to resume.
- DeFi TVL Contraction and Speculative Volume Deceleration: Solana’s Total Value Locked (TVL) remains depressed by over 50% from cycle highs, driven by a sharp drop in DEX memecoin speculative volume and incentive-driven liquidity. Furthermore, weak base-layer fee capture relative to application-level monetization continues to heighten structural valuation concerns among analysts during market pullbacks.
- Linear Supply Expansion and Active Wallet Deceleration: The network is actively absorbing roughly $145.78 million in monthly linear token unlocks, creating continuous inflationary pressure on circulating supply. Combined with recent on-chain metrics indicating a slight reduction in active SOL wallets, this ongoing supply expansion poses immediate price dilution risk if spot trading volume diminishes.
Find out more