TradingKey - As of the European session on August 24, gold (XAUUSD) extended last week's strong momentum today, holding firmly above $4,600 intraday and peaking at $4,659.92, hitting a near three-month high. Last week, gold prices posted a cumulative gain of over 5%, and bulls continued to dominate after the market opened this week. The main drivers behind the recent sustained rise in gold prices are the persistent weakness of the U.S. dollar and safe-haven demand triggered by U.S. fiscal and debt concerns.
Dollar Falls to Near Three-Month Low, Supporting Gold; Focus Turns to July PCE and Warsh Jackson Hole Speech
From a fundamental perspective, the core factor supporting the recent continuous rise in gold prices is the persistent weakness of the US dollar. After the US Department of the Treasury previously announced an expansion of its Treasury buyback program, market concerns over US fiscal conditions, government debt, and the long-term purchasing power of the dollar increased. The US dollar is currently hovering near multi-month lows, making dollar-denominated gold cheaper for overseas investors and driving continued capital inflows into the precious metals market.
Recently, the size of US government debt and long-term borrowing costs have drawn market attention. Even though long-term US Treasury yields remain at high levels, gold has still risen significantly. ING believes that uncertainties surrounding the US fiscal outlook and market concerns over the purchasing power of the US dollar are enhancing the appeal of gold as a store of value.
Looking ahead, the most important factor affecting gold lies with the Federal Reserve. This Wednesday, the US will release July PCE data. If the PCE continues to show cooling inflation, it will further weaken market expectations for further Fed rate hikes, potentially putting pressure on US Treasury yields and the US dollar, thereby supporting a continued rise in gold. Conversely, if core PCE comes in significantly higher than expected, the market may re-elevate rate-hike bets, placing pressure on gold after its rapid gains.
In addition, it is worth noting that on Friday, August 28 (Eastern Time), Federal Reserve Chair Kevin Warsh will deliver a speech at the Jackson Hole Economic Symposium. This will be Warsh's first major speech at Jackson Hole since taking office as Fed Chair. The market is particularly focused on how he evaluates slowing employment, inflation risks, and the future rate path. Recently, Warsh has noticeably reduced explicit guidance on future policy; thus, this speech could serve as a crucial juncture for the market to recalibrate interest rate expectations for September and the end of the year.
If Warsh acknowledges rising risks to economic growth and employment while downplaying the need for further rate hikes, gold may continue to break out upward. However, if he emphasizes that inflation remains above the 2% target and explicitly retains the possibility of another rate hike, the US dollar and US Treasury yields could rebound, and gold might experience significant profit-taking.
Gold Price Technical Analysis
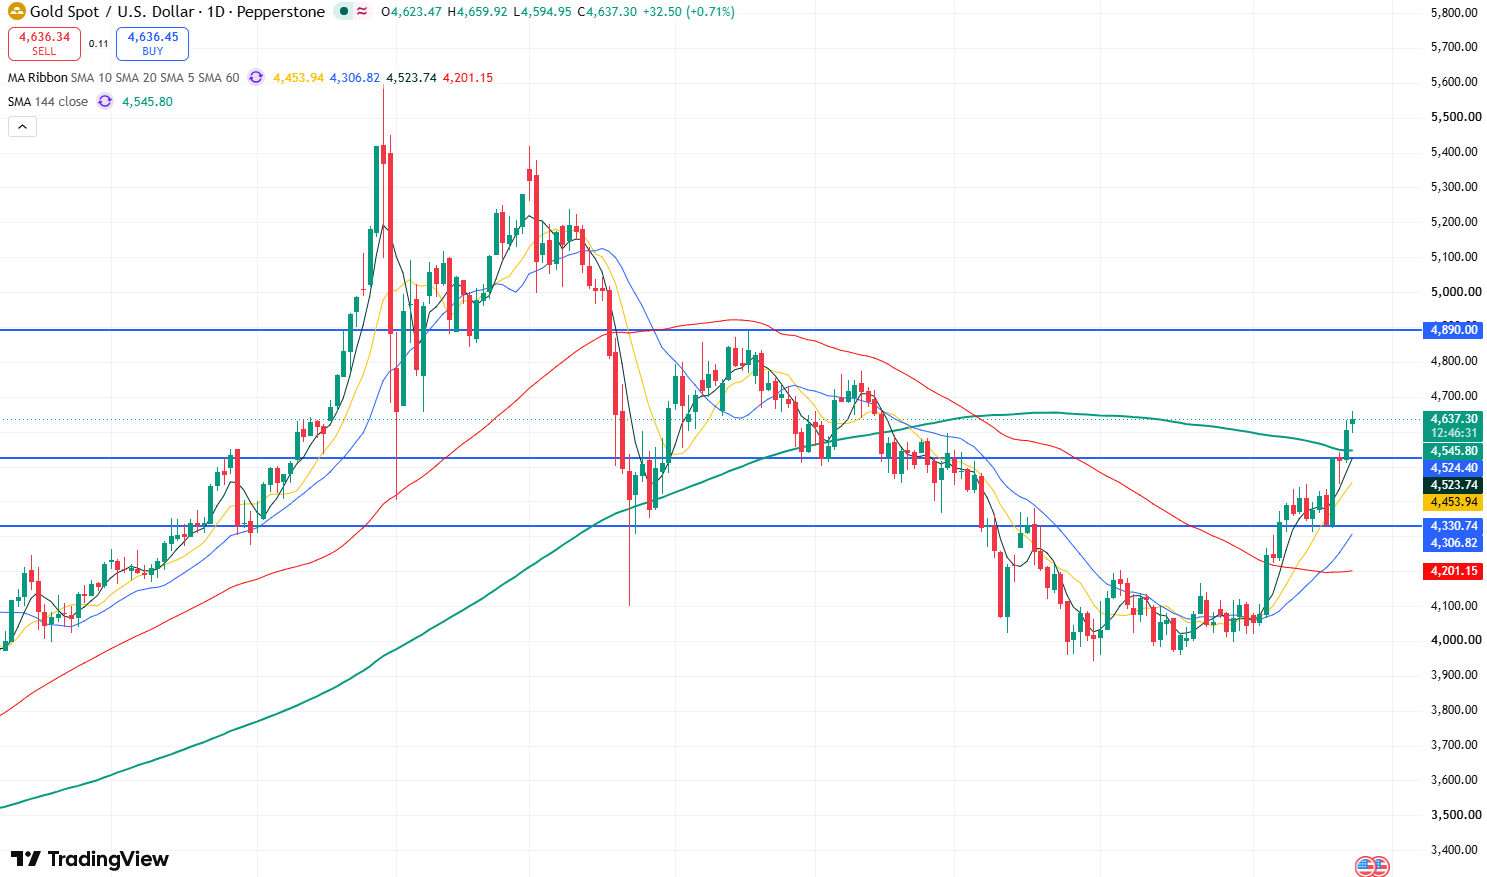
Gold price daily chart, Source: TradingView
Looking at the daily chart of gold prices, gold has recently demonstrated a clear and strong upward trend, briefly breaking through the $4,500 and $4,600 levels. As last week's closing price consolidated above $4,600, gold also broke above and settled over the 144-day moving average. This has further strengthened short-term bullish momentum, breaking out of the pullback phase that had persisted since March this year, suggesting that gold may resume its long-term uptrend.
At present, gold prices are likely to maintain their upward trend in the short term. The first upside target could be testing the May rebound high of $4,773.53, followed by the $4,800 level. If gold stabilizes above $4,800, it will further test the resistance zone at $4,890-$4,900.
On the downside, the primary support to watch below is the $4,600 mark. If this level fails to hold, gold prices may test the 20-period SMA support on the 4-hour chart. A break below the SMA20 could see gold pull back further toward around $4,450.
Find out more