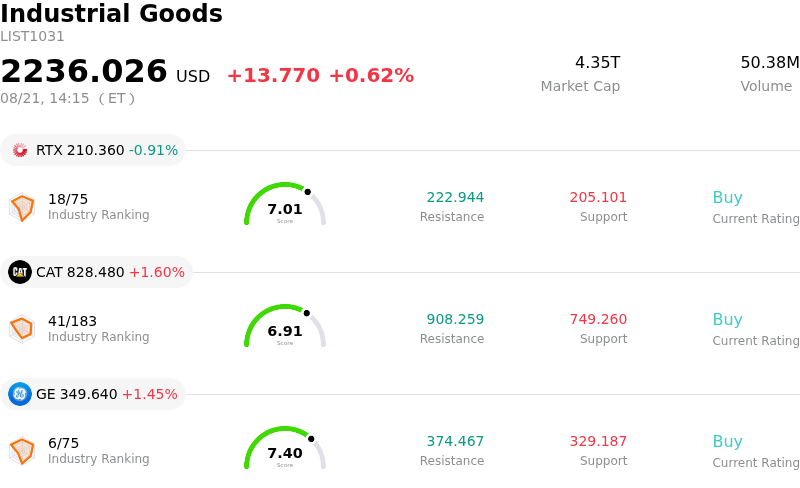
CNH Industrial NV (CNH) moved up by 7.90%. The Industrial Goods sector is up by 0.62%. The company outperformed the industry. Top 3 stocks by turnover in the sector: RTX Corp (RTX) down 0.91%; Caterpillar Inc (CAT) up 1.60%; General Electric Co (GE) up 1.45%.
What is driving CNH Industrial NV (CNH)’s stock price up today?
CNH Industrial experienced a notable upward movement, driven primarily by strong fundamental earnings performance, updated full-year guidance, and improving industry indicators. The company recently reported second-quarter financial results that surpassed Wall Street consensus estimates for both revenue and adjusted earnings per share. Despite ongoing cyclical headwinds across global agricultural equipment markets, disciplined pricing, cost control, and resilient construction sales helped protect profitability. Crucially, management narrowed and raised its full-year financial outlook toward the top end of its prior target ranges, providing institutional investors with increased visibility and reassurance that operational performance is stabilizing.
From an industry standpoint, while farm income remains under pressure due to low commodity prices and elevated input costs, several forward-looking indicators suggest the agricultural equipment cycle is approaching a floor. Dealer network inventories have continued to normalize, fleet aging is fostering underlying replacement demand, and pricing power has held up better than expected. In addition, CNH Industrial has benefited from internal restructuring efforts, supply chain cost reductions, and tariff mitigation initiatives, which together have supported gross margins and cash flow generation even during a volume downturn.
Market sentiment has also been bolstered by favorable analyst commentary and institutional portfolio adjustments. Multiple brokerage firms recently revised their price targets upward or highlighted an improving risk-reward profile, pointing to the company's cost structure enhancements and long-term expansion in high-margin precision agriculture technology. These analyst upgrades, combined with steady institutional accumulation, helped the stock overcome key technical resistance levels. The resulting bullish trading momentum and active buying interest contributed directly to the intraday strength.
Technical Analysis of CNH Industrial NV (CNH)
Technically, CNH Industrial NV (CNH) shows a MACD (12,26,9) value of 0.136, indicating a neutral signal. The RSI at 64.100 suggests neutral condition and the Williams %R at 0.556 suggests overbought condition. Please monitor closely.
Fundamental Analysis of CNH Industrial NV (CNH)
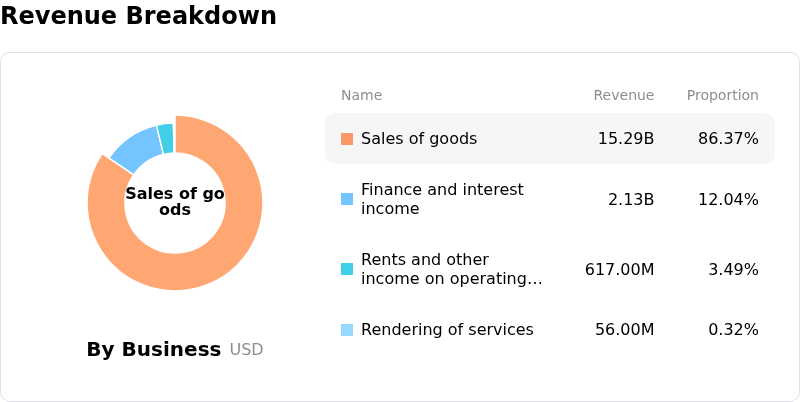
CNH Industrial NV (CNH) is in the Industrial Goods industry. Its latest annual revenue is $18.09B, ranking 10 in the industry. The net profit is $510.00M, ranking 34 in the industry. Company Profile
Over the past month, multiple analysts have rated the company as Buy, with an average price target of $13.48, a high of $20.20, and a low of $10.10.
More details about CNH Industrial NV (CNH)
Company Specific Risks:
- Slim Profit Margins and High Debt Leverage: Despite quarterly revenue reaching $4.8 billion, CNH Industrial operates on a narrow net profit margin of 1.7% while carrying $25.9 billion in total debt against $7.8 billion in equity, driving a debt-to-equity ratio above 3.3x that significantly amplifies financial vulnerability.
- Analyst Earnings Revisions and Regional Demand Slump: Nine institutional analysts revised future earnings estimates downward following an uninspiring investor call hosted by management and DA Davidson, pointing to severe market headwinds in South America where agricultural sales dropped 27% year-over-year.
- Elevated Valuation Multiple and Downside Re-rating Risk: CNH is trading at a high trailing P/E ratio above 40x—well above its 5-year median of 11.8x—placing the stock at an estimated 8.4% premium over its intrinsic fair value of $10.10 and leaving little margin of safety for intraday investors.
- Tariff Headwinds and Segment Margin Compression: Cost of goods sold expanded to 82.1% of net sales, driving Agriculture segment adjusted EBIT margins down to 5.2% (from 8.1% YoY) and Construction margins down to 1.7% (from 4.5% YoY) primarily due to an estimated 470 basis point cost burden from import tariffs.
Find out more